August 28, 2025 a 09:31 am


U.S. Sectors - Performance Analysis
In an ever-evolving economic landscape, understanding the nuanced performance of various U.S. sectors provides critical insight for investors. By examining short-term (1 week), medium-term (1 month), and long-term (3 months) performances, we can discern patterns across defensive and cyclical sectors alike. Our analysis reveals distinct trends that inform future market strategies.
📊 U.S. Sectors Performance One Week
| Sector | Performance (%) | Performance |
|---|---|---|
| Energy | 3.26% | |
| Technology | 2.14% | |
| Financial | 2.04% | |
| Material | 1.95% | |
| Industrial | 1.65% | |
| Transportation | 1.55% | |
| Communication | 1.33% | |
| Real Estate | 1.23% | |
| Retail | 0.75% | |
| Utilities | -0.35% | |
| Healthcare | -0.05% | |
| Consumer Staples | -2.06% |
🗣️ U.S. Sectors Performance One Month
| Sector | Performance (%) | Performance |
|---|---|---|
| Communication | 4.72% | |
| Transportation | 3.46% | |
| Retail | 2.86% | |
| Healthcare | 1.99% | |
| Financial | 1.89% | |
| Material | 1.72% | |
| Utilities | 0.87% | |
| Energy | 0.39% | |
| Industrial | 0.31% | |
| Technology | 0.24% | |
| Consumer Staples | -0.44% | |
| Real Estate | -1.23% |
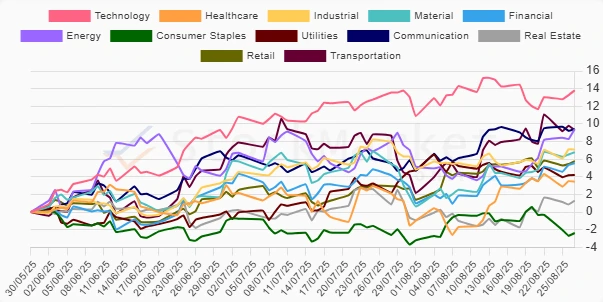
📈 U.S. Sectors Performance Three Months
| Sector | Performance (%) | Performance |
|---|---|---|
| Technology | 13.80% | |
| Energy | 9.40% | |
| Communication | 9.40% | |
| Transportation | 9.31% | |
| Industrial | 7.10% | |
| Material | 6.79% | |
| Retail | 5.79% | |
| Financial | 5.55% | |
| Utilities | 4.20% | |
| Healthcare | 3.45% | |
| Real Estate | 1.30% | |
| Consumer Staples | -2.37% |
✅ Summary
Across all time frames, the Technology sector showcases a consistent positive trajectory, underlining its attractive potential amidst economic fluctuations. Short-term vigor in the Energy sector contrasts broader defensive weaknesses observed, especially in Consumer Staples. Communication shines in the one-month analysis, reflecting robust consumer interest propelled by rapid technological adoption. Investors should weigh cyclical opportunities against these defensive undercurrents for a balanced portfolio strategy.
Smart Data Insight
Master the Perfect Entry & Exit for this Stock
Don't leave your profits to chance. Historically, this stock follows specific seasonal patterns that institutional traders use to maximize returns.
- ✅ Identify the "Golden Buying Window"
- ✅ Avoid high-risk correction cycles
- ✅ Backtested data from the last 20+ years