
August 27, 2026 a 09:31 am


U.S. Sectors - Performance Analysis
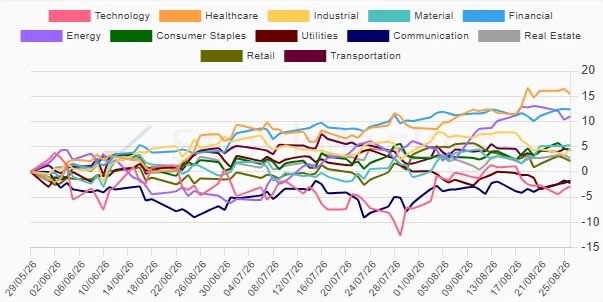
An exhaustive examination of U.S. sector performances over multiple time horizons reveals valuable insights into market dynamics. The analysis covers a week, a month, and three months, highlighting prominent performers and identifying laggards. The nuanced interpretation of defensive versus cyclical sectors is crucial for strategic investment decisions.
📊 U.S. Sectors Performance One Week
| Sector | Performance (%) | Performance |
|---|---|---|
| Material | 2.38 | |
| Financial | 2.28 | |
| Communication | 1.75 | |
| Retail | 1.24 | |
| Consumer Staples | 1.14 | |
| Transportation | 1.10 | |
| Healthcare | 0.68 | |
| Industrial | 0.33 | |
| Real Estate | 0.02 | |
| Utilities | -0.56 | |
| Technology | -0.12 | |
| Energy | -2.06 |
📊 U.S. Sectors Performance One Month
| Sector | Performance (%) | Performance |
|---|---|---|
| Energy | 8.35 | |
| Technology | 7.04 | |
| Healthcare | 3.84 | |
| Communication | 2.81 | |
| Material | 2.65 | |
| Financial | 1.17 | |
| Retail | 0.50 | |
| Transportation | 0.38 | |
| Consumer Staples | -0.83 | |
| Industrial | -1.03 | |
| Real Estate | -1.97 | |
| Utilities | -4.43 |
📊 U.S. Sectors Performance Three Months
| Sector | Performance (%) | Performance |
|---|---|---|
| Healthcare | 15.42 | |
| Financial | 12.38 | |
| Energy | 10.98 | |
| Material | 5.28 | |
| Industrial | 4.53 | |
| Transportation | 4.42 | |
| Consumer Staples | 4.35 | |
| Real Estate | 2.74 | |
| Retail | 2.16 | |
| Utilities | -1.76 | |
| Communication | -2.21 | |
| Technology | -2.90 |
Summary
The performance analysis of U.S. sectors over varying time horizons reveals a clear distinction between cyclical and defensive plays. Energy, consistently robust, mirrors traditional market upswings while Healthcare shows defensive strength over a three-month period. Technology's fluctuation over three months highlights market sensitivity to tech-centric market conditions. This analysis underscores the importance of balanced sector exposure catering to both upward market trends and defensive strategies for diversified risk management. The definitive recommendation involves a strategic blend of high-performing sectors with guarded investments in defensive segments to mitigate potential volatility.
Smart Data Insight
Master the Perfect Entry & Exit for this Stock
Don't leave your profits to chance. Historically, this stock follows specific seasonal patterns that institutional traders use to maximize returns.
- ✅ Identify the "Golden Buying Window"
- ✅ Avoid high-risk correction cycles
- ✅ Backtested data from the last 20+ years