June 26, 2025 a 09:32 am


U.S. Sectors - Performance Analysis
Analyzing the recent performance of U.S. sectors reveals significant trends and pivotal movements. With varied outcomes across different time frames, the analysis below delves into the gains and losses that depict the sector's health and future outlook. Cyclical sectors are showing promising strides in the short term, while defensive sectors offer a mixed bag.
📊 U.S. Sectors Performance One Week
| Sector | Performance (%) | Performance |
|---|---|---|
| Transportation | 3.45 | |
| Technology | 3.18 | |
| Financial | 2.36 | |
| Communication | 1.68 | |
| Industrial | 1.11 | |
| Retail | 0.91 | |
| Healthcare | 0.51 | |
| Utilities | -0.07 | |
| Consumer Staples | -0.23 | |
| Material | -0.21 | |
| Real Estate | -1.43 | |
| Energy | -4.04 |
📊 U.S. Sectors Performance One Month
| Sector | Performance (%) | Performance |
|---|---|---|
| Technology | 7.21 | |
| Communication | 3.36 | |
| Energy | 2.37 | |
| Transportation | 1.01 | |
| Healthcare | 1.35 | |
| Financial | 0.99 | |
| Industrial | 0.35 | |
| Retail | -0.03 | |
| Real Estate | -0.14 | |
| Material | -0.40 | |
| Utilities | -1.38 | |
| Consumer Staples | -2.54 |
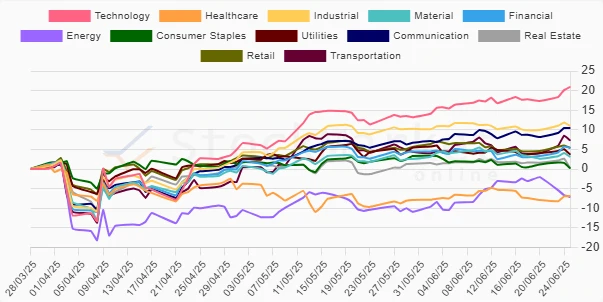
📊 U.S. Sectors Performance Three Months
| Sector | Performance (%) | Performance |
|---|---|---|
| Technology | 20.97 | |
| Industrial | 10.97 | |
| Communication | 10.44 | |
| Transportation | 7.27 | |
| Retail | 5.40 | |
| Financial | 5.38 | |
| Utilities | 3.71 | |
| Material | 3.11 | |
| Real Estate | 0.21 | |
| Consumer Staples | 0.20 | |
| Healthcare | -6.91 | |
| Energy | -7.13 |
🔍 Summary
The analysis highlights Technology as a consistent top performer across all time frames, showcasing resilience and growth potential. Conversely, the Energy sector displayed volatility, with significant losses in the short-term and maintained declines over a three-month span. Defensive sectors like Healthcare and Consumer Staples registered mixed results, underlining market sensitivity and potential cautionary positions. Investors might consider focusing on cyclical sectors showing robust improvement while maintaining a cautious approach towards defensive areas.
Smart Data Insight
Master the Perfect Entry & Exit for this Stock
Don't leave your profits to chance. Historically, this stock follows specific seasonal patterns that institutional traders use to maximize returns.
- ✅ Identify the "Golden Buying Window"
- ✅ Avoid high-risk correction cycles
- ✅ Backtested data from the last 20+ years