
February 26, 2026 a 09:31 am


U.S. Sectors - Performance Analysis
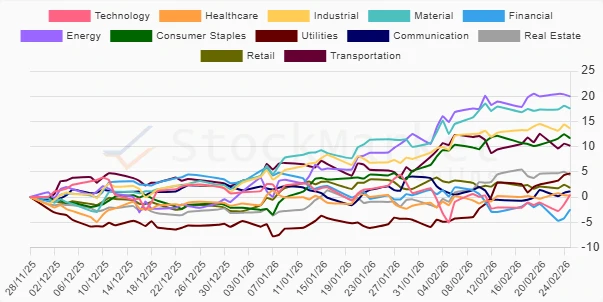
The U.S. sector performance analysis indicates a diverse landscape over short-term periods. While some sectors are showing consistent growth, others are exhibiting volatility. Tracking the performances over various periods highlights trends that can guide strategic investment decisions. Understanding sector dynamics aids in navigating defensive and cyclical plays effectively.
📊 U.S. Sectors Performance One Week
| Sector | Performance (%) | Performance |
|---|---|---|
| Utilities | 2.69 | |
| Technology | 2.02 | |
| Consumer Staples | 1.54 | |
| Communication | 1.19 | |
| Real Estate | 0.56 | |
| Material | 0.45 | |
| Healthcare | 0.37 | |
| Retail | 0.18 | |
| Industrial | -0.40 | |
| Financial | -0.46 | |
| Energy | -0.56 | |
| Transportation | -0.68 |
📊 U.S. Sectors Performance One Month
| Sector | Performance (%) | Performance |
|---|---|---|
| Energy | 10.20 | |
| Utilities | 8.79 | |
| Consumer Staples | 6.91 | |
| Industrial | 6.28 | |
| Material | 6.17 | |
| Real Estate | 5.27 | |
| Transportation | 5.24 | |
| Healthcare | 1.58 | |
| Communication | -0.25 | |
| Retail | -1.13 | |
| Financial | -2.00 | |
| Technology | -3.17 |
📊 U.S. Sectors Performance Three Months
| Sector | Performance (%) | Performance |
|---|---|---|
| Energy | 19.94 | |
| Material | 17.54 | |
| Industrial | 13.60 | |
| Consumer Staples | 11.65 | |
| Transportation | 10.17 | |
| Utilities | 4.69 | |
| Real Estate | 4.35 | |
| Retail | 1.83 | |
| Communication | 1.12 | |
| Technology | 0.43 | |
| Healthcare | 0.30 | |
| Financial | -2.47 |
💡 Summary
Analyzing the U.S. sector performance over different time frames reveals varying trends across the market. Defensive sectors like Utilities and Consumer Staples display robust one-week performances, while Energy leads over the one-month and three-month periods, suggesting volatility and potential in energy markets. Cyclical sectors such as Industrial and Materials show strong rebounds, especially over the longer three-month period. Strategic asset allocation should consider these dynamic shifts to harness strengths and mitigate risks effectively.
Smart Data Insight
Master the Perfect Entry & Exit for this Stock
Don't leave your profits to chance. Historically, this stock follows specific seasonal patterns that institutional traders use to maximize returns.
- ✅ Identify the "Golden Buying Window"
- ✅ Avoid high-risk correction cycles
- ✅ Backtested data from the last 20+ years