September 25, 2025 a 09:31 am


U.S. Sectors - Performance Analysis
The U.S. sectoral performance over various time horizons showcases dynamic shifts influenced by macroeconomic factors. In the short term, defensive sectors demonstrate typical stability, whereas cyclical sectors reflect the market's risk appetite over medium terms. The analysis captures these nuances across one week, one month, and three-month periods, revealing key trends and potential investment considerations.
📊 U.S. Sectors Performance One Week
Analyzing the past week, Utilities emerged as the top performer, reflecting its defensive nature amidst market volatility. Conversely, the Material sector experienced the most significant decline, indicating sector-specific challenges possibly tied to global commodity price fluctuations.
| Sector | Performance (%) | Performance |
|---|---|---|
| Utilities | 2.16 | |
| Transportation | 1.03 | |
| Technology | 0.87 | |
| Energy | 0.73 | |
| Healthcare | -0.78 | |
| Retail | -0.73 | |
| Industrial | -0.33 | |
| Real Estate | -1.16 | |
| Communication | -1.26 | |
| Consumer Staples | -1.27 | |
| Financial | -0.96 | |
| Material | -2.09 |
📈 U.S. Sectors Performance One Month
Over the past month, Technology and Communication sectors saw strong gains, indicating bullish sentiment driven by technological advancements and consumer demand. Conversely, the Materials sector again lagged, highlighting persistent challenges.
| Sector | Performance (%) | Performance |
|---|---|---|
| Technology | 5.78 | |
| Communication | 5.68 | |
| Energy | 2.49 | |
| Utilities | 1.20 | |
| Retail | 0.80 | |
| Financial | -0.06 | |
| Healthcare | -0.43 | |
| Transportation | -0.30 | |
| Industrial | -0.54 | |
| Real Estate | -0.99 | |
| Consumer Staples | -2.48 | |
| Material | -3.20 |
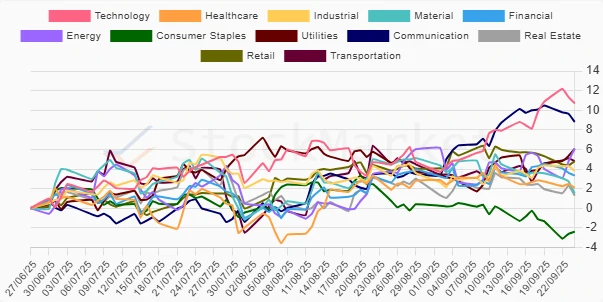
📉 U.S. Sectors Performance Three Months
Over the quarter, Technology led with impressive gains, supported by robust demand. Communication followed closely, driven by digital transformation trends. Interestingly, Utilities showed resilience again, positioning as a reliable defensive bet.
| Sector | Performance (%) | Performance |
|---|---|---|
| Technology | 10.71 | |
| Communication | 8.81 | |
| Energy | 6.08 | |
| Utilities | 6.05 | |
| Transportation | 4.81 | |
| Retail | 4.80 | |
| Industrial | 3.79 | |
| Financial | 3.33 | |
| Healthcare | 2.08 | |
| Material | 1.52 | |
| Real Estate | 1.30 | |
| Consumer Staples | -2.39 |
🔍 Summary
The comprehensive sectoral analysis over the examined time periods reveals divergent performance trajectories influenced by diverse drivers. Technology and Communication sectors consistently outperformed, driven by innovation, while defensive sectors like Utilities provided stability. The Materials sector faced headwinds across all periods, underscoring sector-specific volatility risks. Investors should balance between growth opportunities in Technology and stability in defensive sectors when strategizing amidst market uncertainties.
Smart Data Insight
Master the Perfect Entry & Exit for this Stock
Don't leave your profits to chance. Historically, this stock follows specific seasonal patterns that institutional traders use to maximize returns.
- ✅ Identify the "Golden Buying Window"
- ✅ Avoid high-risk correction cycles
- ✅ Backtested data from the last 20+ years