
June 25, 2026 a 09:31 am

U.S. Sectors - Performance Analysis
The U.S. stock market presents a dynamic picture over various periods, reflecting both opportunities and challenges across sectors. This analysis delves into performance patterns, highlighting leading and lagging sectors, and offering insights into defensive versus cyclical trends. Investors should keep a keen eye on sector-specific drivers and broader economic influences when making portfolio decisions.
📊 U.S. Sectors Performance One Week
Throughout the past week, sector performances have demonstrated mixed results, with defensive sectors like Utilities and Healthcare showing resilience, while technology suffered losses. This trend suggests a cautious market sentiment.
| Sector | Performance (%) | Performance |
|---|---|---|
| Healthcare | 2.62% | |
| Utilities | 1.73% | |
| Transportation | 1.63% | |
| Real Estate | 1.48% | |
| Consumer Staples | 1.39% | |
| Retail | 0.50% | |
| Financial | 0.28% | |
| Industrial | -0.36% | |
| Energy | -0.35% | |
| Material | -1.25% | |
| Communication | -2.67% | |
| Technology | -4.39% |
📊 U.S. Sectors Performance One Month
The monthly performance analysis shows Financial and Industrial sectors leading the pack, propelled by strong market conditions and policy support, while Communication and Energy face significant headwinds.
| Sector | Performance (%) | Performance |
|---|---|---|
| Financial | 3.61% | |
| Industrial | 3.51% | |
| Healthcare | 3.33% | |
| Transportation | 2.97% | |
| Consumer Staples | 1.10% | |
| Utilities | 0.60% | |
| Material | 0.50% | |
| Real Estate | -0.34% | |
| Technology | -0.42% | |
| Retail | -0.83% | |
| Energy | -7.49% | |
| Communication | -8.00% |
📊 U.S. Sectors Performance Three Months
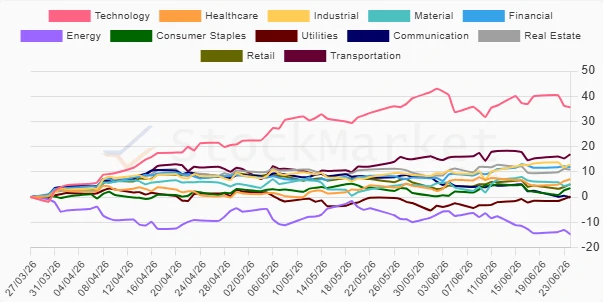
Over the quarterly horizon, Technology dominates with exceptional returns, supported by strong earnings and innovation. Positive gains in the Transportation and Industrial sectors further highlight economic optimism post-recovery, whereas Energy struggles under persistent global supply chain issues.
| Sector | Performance (%) | Performance |
|---|---|---|
| Technology | 35.60% | |
| Transportation | 16.94% | |
| Industrial | 12.96% | |
| Real Estate | 10.90% | |
| Financial | 11.88% | |
| Healthcare | 7.09% | |
| Retail | 5.07% | |
| Material | 4.93% | |
| Consumer Staples | 3.50% | |
| Utilities | 0.23% | |
| Communication | -0.19% | |
| Energy | -14.74% |
🔍 Summary
Throughout the assessed periods, significant discrepancies in sectoral performance highlight the ongoing evolution in market dynamics. While Technology garners unparalleled gains, energy struggles signify a potential reevaluation. Investors are advised to remain flexible, leveraging lead indicators and aligning to macroeconomic movements for opportunistic positioning.
Smart Data Insight
Master the Perfect Entry & Exit for this Stock
Don't leave your profits to chance. Historically, this stock follows specific seasonal patterns that institutional traders use to maximize returns.
- ✅ Identify the "Golden Buying Window"
- ✅ Avoid high-risk correction cycles
- ✅ Backtested data from the last 20+ years