December 25, 2025 a 09:31 am


U.S. Sectors - Performance Analysis
The U.S. financial markets exhibit intricate interrelations between sectors. Short-term fluctuations reveal the market sentiment swings, while long-term performances often show macroeconomic undercurrents. Identifying the top and underperforming sectors over various timeframes aids in understanding the broader economic influences and investor sentiment dynamics.
📊 U.S. Sectors Performance One Week
This week's performance highlights strong momentum in Technology, Financial, and Industrial sectors, showcasing investor confidence. Meanwhile, Consumer Staples and Utilities show a decline, potentially suggesting a shift away from defensive positioning.
| Sector | Performance (%) | Performance |
|---|---|---|
| Technology | 3.33 | |
| Financial | 2.17 | |
| Industrial | 1.90 | |
| Communication | 1.39 | |
| Material | 1.48 | |
| Healthcare | 1.22 | |
| Transportation | 0.74 | |
| Energy | 0.55 | |
| Retail | -0.79 | |
| Utilities | -0.85 | |
| Real Estate | -0.09 | |
| Consumer Staples | -1.35 |
📊 U.S. Sectors Performance One Month
Over the past month, Financial, Transportation, and Material sectors have led the gains, suggesting a preference for cyclicals, while Utilities faced headwinds. This may indicate a shift towards risk-on sentiment.
| Sector | Performance (%) | Performance |
|---|---|---|
| Financial | 5.96 | |
| Transportation | 5.71 | |
| Material | 4.37 | |
| Technology | 4.36 | |
| Industrial | 3.68 | |
| Communication | 3.29 | |
| Consumer Staples | 0.11 | |
| Energy | 0.29 | |
| Retail | -0.25 | |
| Real Estate | -2.03 | |
| Healthcare | -1.83 | |
| Utilities | -3.60 |
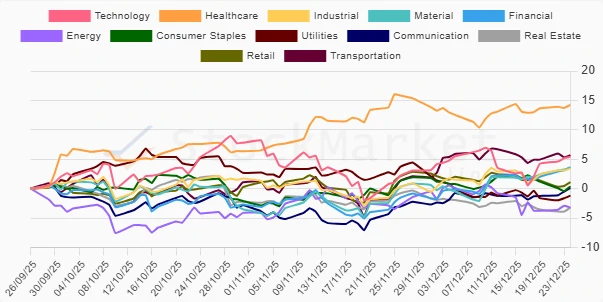
📊 U.S. Sectors Performance Three Months
The Healthcare sector has notably outperformed over the last quarter, driven by defensive plays, while Energy and Real Estate struggled. This suggests a mixed investor sentiment with a tilt towards stability in uncertain conditions.
| Sector | Performance (%) | Performance |
|---|---|---|
| Healthcare | 14.22 | |
| Transportation | 5.66 | |
| Technology | 5.40 | |
| Financial | 3.64 | |
| Material | 3.45 | |
| Industrial | 3.41 | |
| Retail | 1.09 | |
| Consumer Staples | 0.36 | |
| Communication | 0.10 | |
| Utilities | -1.20 | |
| Energy | -3.21 | |
| Real Estate | -3.26 |
🔍 Summary
In conclusion, the U.S. sectors' performance reflects a gradual recovery with selective bets on cyclicals like Financials and Technology. Meanwhile, Healthcare's robust showing in the three-month view suggests ongoing demand for stability amidst volatility. Investors should consider balanced exposure, paying attention to macroeconomic cues, and sector-specific developments.
Smart Data Insight
Master the Perfect Entry & Exit for this Stock
Don't leave your profits to chance. Historically, this stock follows specific seasonal patterns that institutional traders use to maximize returns.
- ✅ Identify the "Golden Buying Window"
- ✅ Avoid high-risk correction cycles
- ✅ Backtested data from the last 20+ years