
September 24, 2026 a 09:31 am


U.S. Sectors - Performance Analysis
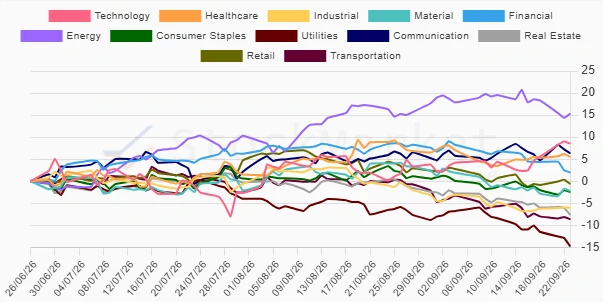
The U.S. sectors have experienced a varied performance across different time horizons. This analysis aims to shed light on the trends and insights gleaned from sector performances over 1 week, 1 month, and 3 months. A careful assessment of cyclical and defensive sectors provides a nuanced understanding of market dynamics.
U.S. Sectors Performance One Week 📆
| Sector | Performance (%) | Performance |
|---|---|---|
| Technology | 3.85 | |
| Communication | 0.28 | |
| Retail | 0.02 | |
| Industrial | 0.65 | |
| Healthcare | 0.00 | |
| Material | -0.82 | |
| Consumer Staples | -1.26 | |
| Transportation | -1.30 | |
| Financial | -2.41 | |
| Real Estate | -2.57 | |
| Energy | -3.27 | |
| Utilities | -4.73 |
U.S. Sectors Performance One Month 📆
| Sector | Performance (%) | Performance |
|---|---|---|
| Technology | 7.43 | |
| Energy | 0.68 | |
| Communication | -0.37 | |
| Retail | -4.66 | |
| Industrial | -4.67 | |
| Consumer Staples | -4.79 | |
| Healthcare | -3.67 | |
| Material | -6.26 | |
| Financial | -6.62 | |
| Real Estate | -8.01 | |
| Utilities | -8.48 | |
| Transportation | -8.94 |
U.S. Sectors Performance Three Months 📆
| Sector | Performance (%) | Performance |
|---|---|---|
| Energy | 15.32 | |
| Technology | 8.54 | |
| Communication | 6.37 | |
| Healthcare | 5.56 | |
| Financial | 2.00 | |
| Retail | -0.61 | |
| Material | -2.21 | |
| Consumer Staples | -2.42 | |
| Industrial | -6.00 | |
| Real Estate | -7.59 | |
| Transportation | -8.60 | |
| Utilities | -14.76 |
Summary 🗣️
In the short term, Technology has emerged as a clear leader with consistent gains, boosted by positive tech momentum and investor sentiment. However, the defensive Utilities sector suffered significant losses, indicating possible shifts in market sentiment. Over the longer-term horizon, Energy showed robust growth, likely driven by geopolitical factors and fluctuating oil prices. Cyclical sectors struggled, but defensive sectors like Healthcare gained in the three-month analysis. Investors should consider a balanced approach, diversifying between high-performing technology and resilient healthcare sectors. Monitoring economic indicators should guide future investment strategies.
Smart Data Insight
Master the Perfect Entry & Exit for this Stock
Don't leave your profits to chance. Historically, this stock follows specific seasonal patterns that institutional traders use to maximize returns.
- ✅ Identify the "Golden Buying Window"
- ✅ Avoid high-risk correction cycles
- ✅ Backtested data from the last 20+ years