
October 22, 2026 a 09:31 am


U.S. Sectors - Performance Analysis
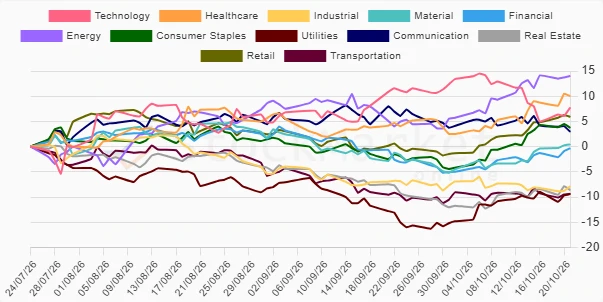
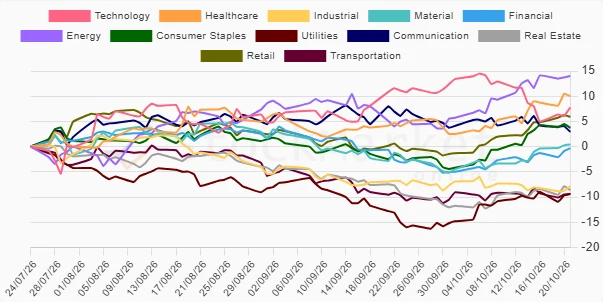
In the recent analysis of the U.S. sectors, performance across various durations highlighted key trends and insights. Over a one-week period, the Energy sector showcased remarkable gains, whereas the Communication sector faced significant challenges. A diversified view over a one-month and three-month period presents a nuanced understanding of cyclical versus defensive sectors. Understanding these dynamics is crucial for strategic investment decisions.
U.S. Sectors Performance One Week 📊
| Sector | Performance (%) | Performance |
|---|---|---|
| Energy | 2.41% | |
| Material | 1.50% | |
| Financial | 1.39% | |
| Retail | 1.09% | |
| Healthcare | 1.01% | |
| Utilities | 0.88% | |
| Consumer Staples | 0.50% | |
| Industrial | 0.26% | |
| Real Estate | 0.18% | |
| Technology | -0.27% | |
| Transportation | -1.18% | |
| Communication | -3.12% |
U.S. Sectors Performance One Month 🗣️
| Sector | Performance (%) | Performance |
|---|---|---|
| Energy | 10.00% | |
| Healthcare | 5.33% | |
| Retail | 5.29% | |
| Consumer Staples | 5.25% | |
| Utilities | 3.71% | |
| Financial | 2.28% | |
| Material | 1.62% | |
| Transportation | -0.20% | |
| Real Estate | -0.93% | |
| Industrial | -1.09% | |
| Technology | -3.85% | |
| Communication | -4.00% |
U.S. Sectors Performance Three Months 📈
| Sector | Performance (%) | Performance |
|---|---|---|
| Energy | 14.01% | |
| Healthcare | 10.01% | |
| Technology | 7.74% | |
| Retail | 5.90% | |
| Consumer Staples | 3.73% | |
| Communication | 2.94% | |
| Material | 0.43% | |
| Financial | -0.33% | |
| Industrial | -7.87% | |
| Transportation | -9.37% | |
| Real Estate | -8.62% | |
| Utilities | -9.41% |
Summary ✅
The analysis over various periods has emphasized the dynamic performance of different U.S. market sectors. Energy and Healthcare sectors have consistently outperformed, highlighting their resilience and growth potential. On the other hand, sectors like Transportation and Utilities faced persistent challenges, reflective of broader industry shifts. Investors should consider these trends, focusing on diversified portfolios balancing cyclical and defensive sectors to optimize risk-adjusted returns.
Smart Data Insight
Master the Perfect Entry & Exit for this Stock
Don't leave your profits to chance. Historically, this stock follows specific seasonal patterns that institutional traders use to maximize returns.
- ✅ Identify the "Golden Buying Window"
- ✅ Avoid high-risk correction cycles
- ✅ Backtested data from the last 20+ years