
January 22, 2026 a 09:31 am


U.S. Sectors - Performance Analysis
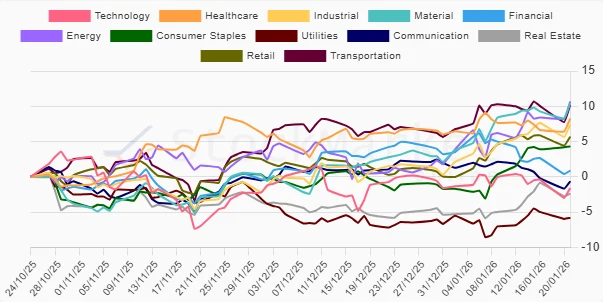
📊 This report provides an analysis of the recent performance in U.S. sectors over 1-week, 1-month, and 3-month periods. By investigating the dynamic behavior of both defensive and cyclical sectors, we can garner insights into current market trends and future expectations. From volatile energy sectors to stable consumer staples, understanding these movements aids strategic investment decisions.
U.S. Sectors Performance One Week
| Sector | Performance (%) | Performance |
|---|---|---|
| Energy | 2.40 | |
| Healthcare | 0.84 | |
| Material | 0.60 | |
| Industrial | 0.39 | |
| Consumer Staples | 0.08 | |
| Retail | -0.16 | |
| Real Estate | -0.34 | |
| Transportation | -0.52 | |
| Technology | -1.10 | |
| Utilities | -1.35 | |
| Communication | -1.35 | |
| Financial | -1.66 |
U.S. Sectors Performance One Month
| Sector | Performance (%) | Performance |
|---|---|---|
| Energy | 9.35 | |
| Material | 7.49 | |
| Consumer Staples | 6.22 | |
| Industrial | 5.90 | |
| Retail | 5.26 | |
| Transportation | 3.45 | |
| Real Estate | 3.40 | |
| Healthcare | 2.14 | |
| Utilities | 1.02 | |
| Communication | -2.34 | |
| Technology | -1.39 | |
| Financial | -3.53 |
U.S. Sectors Performance Three Months
| Sector | Performance (%) | Performance |
|---|---|---|
| Energy | 10.65 | |
| Material | 10.44 | |
| Transportation | 10.18 | |
| Healthcare | 8.26 | |
| Industrial | 7.38 | |
| Retail | 5.68 | |
| Consumer Staples | 4.30 | |
| Financial | 0.88 | |
| Communication | -0.65 | |
| Real Estate | -2.39 | |
| Technology | -1.60 | |
| Utilities | -5.82 |
Summary
✅ Across all periods, Energy and Materials sectors exhibit robust growth, indicative of strong cyclical sector performance buoyed by broader economic optimism. Defensive sectors like Utilities and Communication Services posted declines, suggesting risk-on sentiment among investors over recent months. The data highlights the shifting dynamics in sector preferences, warranting careful reevaluation of investment portfolios to align with these macroeconomic trends.
Smart Data Insight
Master the Perfect Entry & Exit for this Stock
Don't leave your profits to chance. Historically, this stock follows specific seasonal patterns that institutional traders use to maximize returns.
- ✅ Identify the "Golden Buying Window"
- ✅ Avoid high-risk correction cycles
- ✅ Backtested data from the last 20+ years