May 21, 2026 a 09:31 am
U.S. Sectors - Performance Analysis
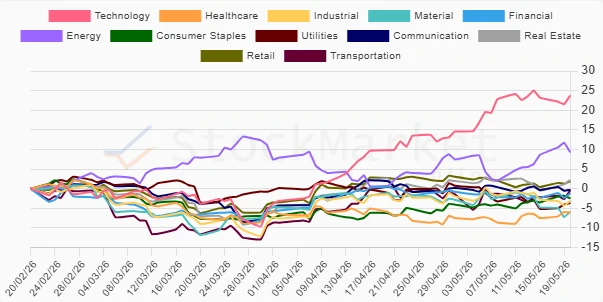
In the dynamic landscape of U.S. equity markets, sector performance provides a crucial lens for assessing economic trends and investment opportunities. Over the past week, month, and quarter, varying performances among different sectors have been observed, reflecting wider market themes. Defensive and cyclical sectors have alternated in leading market activity, showcasing the diverse investment climate.
📊 U.S. Sectors Performance One Week
| Sector | Performance (%) | Performance |
|---|---|---|
| Energy | 3.02 | |
| Transportation | 1.61 | |
| Real Estate | 1.20 | |
| Financial | 0.74 | |
| Consumer Staples | 0.65 | |
| Retail | 0.48 | |
| Healthcare | 0.36 | |
| Utilities | -0.84 | |
| Communication | -0.85 | |
| Technology | -1.28 | |
| Industrial | -2.16 | |
| Material | -3.77 |

📊 U.S. Sectors Performance One Month
| Sector | Performance (%) | Performance |
|---|---|---|
| Technology | 13.87 | |
| Energy | 7.10 | |
| Consumer Staples | 4.47 | |
| Real Estate | 1.54 | |
| Healthcare | 0.90 | |
| Transportation | -0.54 | |
| Retail | -0.70 | |
| Industrial | -0.24 | |
| Communication | -0.84 | |
| Utilities | -0.84 | |
| Financial | -1.17 | |
| Material | -3.87 |
📊 U.S. Sectors Performance Three Months
| Sector | Performance (%) | Performance |
|---|---|---|
| Technology | 23.76 | |
| Energy | 9.28 | |
| Real Estate | 2.21 | |
| Retail | 1.79 | |
| Communication | -0.32 | |
| Transportation | -0.43 | |
| Financial | -1.27 | |
| Consumer Staples | -2.47 | |
| Industrial | -3.18 | |
| Utilities | -3.69 | |
| Material | -5.89 | |
| Healthcare | -6.11 |

🔍 Summary
The analysis of U.S. sectors over the past week, month, and quarter reveals significant insights into market breadth and investment tendencies. Technology remains a standout over the monthly and quarterly periods, driven by innovation and growth prospects. Conversely, defensive sectors such as Utilities and Healthcare exhibited underperformance, particularly in the quarterly horizon, indicating a preference shift towards higher-risk investments by market participants. Investors seeking balanced exposure should consider a strategic mix of cyclical and defensive plays to navigate ongoing market volatility.
Smart Data Insight
Master the Perfect Entry & Exit for this Stock
Don't leave your profits to chance. Historically, this stock follows specific seasonal patterns that institutional traders use to maximize returns.
- ✅ Identify the "Golden Buying Window"
- ✅ Avoid high-risk correction cycles
- ✅ Backtested data from the last 20+ years