
August 21, 2025 a 09:31 am


U.S. Sectors - Performance Analysis 📊
The recent performance of U.S. sectors across various time frames presents an intriguing landscape of market dynamics. In a period characterized by both volatility and opportunity, investors can glean insights into market sentiment and economic forecasts by analyzing these sector movements. The performance metrics over one week, one month, and three months reveal both defensive plays and growth potential in cyclical sectors.
U.S. Sectors Performance One Week 📈
Over the past week, the healthcare sector emerged as the top performer with a significant gain, suggesting a defensive play amidst market fluctuations. Real estate and consumer staples also show notable resilience, while technology and communication sectors faced headwinds.
| Sector | Performance (%) | Performance |
|---|---|---|
| Healthcare | 2.63% | |
| Real Estate | 1.88% | |
| Consumer Staples | 1.63% | |
| Transportation | 0.38% | |
| Utilities | 0.35% | |
| Energy | 0.27% | |
| Retail | 0.67% | |
| Material | 0.10% | |
| Industrial | 0.06% | |
| Financial | -0.26% | |
| Communication | -1.22% | |
| Technology | -2.98% |
U.S. Sectors Performance One Month 📈
The one-month period highlights the resilience of the retail sector, with healthcare closely following as a strong performer. This period shows increased consumer activity and a stable outlook on defensive sectors. Regional trends underscore the importance of sectoral balance in portfolio construction.
| Sector | Performance (%) | Performance |
|---|---|---|
| Retail | 3.61% | |
| Healthcare | 3.07% | |
| Consumer Staples | 2.00% | |
| Communication | 1.89% | |
| Utilities | 1.37% | |
| Technology | 0.48% | |
| Energy | 0.46% | |
| Financial | 0.41% | |
| Industrial | 0.18% | |
| Transportation | -0.67% | |
| Material | -1.87% | |
| Real Estate | -2.03% |
U.S. Sectors Performance Three Months 📈
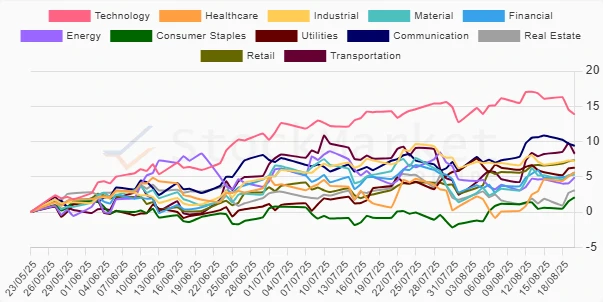
Over the last quarter, technology and communication sectors posted impressive gains, marking a return to growth and investor optimism. This long-range analysis reveals a stronger alignment towards growth sectors, contrasting with the modest performance in defensive arenas. It underscores a potential macroeconomic recovery or growth expectation.
| Sector | Performance (%) | Performance |
|---|---|---|
| Technology | 13.85% | |
| Communication | 9.40% | |
| Transportation | 8.29% | |
| Retail | 7.34% | |
| Industrial | 7.22% | |
| Utilities | 6.30% | |
| Financial | 5.65% | |
| Healthcare | 5.60% | |
| Material | 5.31% | |
| Energy | 4.91% | |
| Real Estate | 3.10% | |
| Consumer Staples | 2.10% |
Summary ⚠️
In conclusion, the performance of U.S. sectors over the past three months underscores a shift towards growth-oriented stocks, particularly within the technology and communication sectors. While defensive sectors such as healthcare provide stability, the current trend suggests an investor appetite for risk and potential growth. Strategic asset allocation should consider these dynamics, balancing cyclical and defensive plays to navigate potential market volatility.
Smart Data Insight
Master the Perfect Entry & Exit for this Stock
Don't leave your profits to chance. Historically, this stock follows specific seasonal patterns that institutional traders use to maximize returns.
- ✅ Identify the "Golden Buying Window"
- ✅ Avoid high-risk correction cycles
- ✅ Backtested data from the last 20+ years