
August 20, 2026 a 09:32 am
 📊
📊
 📊
📊
 📊
📊
 💡
💡
U.S. Sectors - Performance Analysis
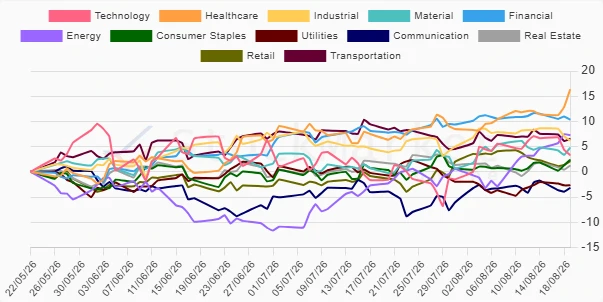
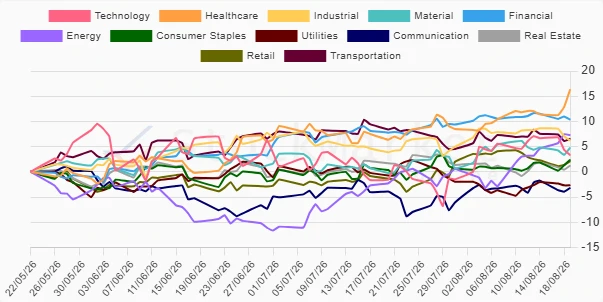
Analyzing the recent performance across various U.S. sectors reveals a dynamic interplay between cyclical and defensive sectors amidst economic fluctuations. While Healthcare and Energy sectors demonstrated notable resilience over multiple periods, Technology and Communication experienced variable trajectories. This analysis delves into the intricate sector-specific trends, offering insights into potential strategic positioning.
U.S. Sectors Performance One Week
During the past week, Healthcare emerged as a standout performer with 4.32% appreciation, accentuated by Energy's solid 4.07% growth. On the opposite spectrum, Technology underperformed with a substantial -3.78% decline, highlighting market rotation tendencies.
| Sector | Performance (%) | Performance |
|---|---|---|
| Healthcare | 4.32% | |
| Energy | 4.07% | |
| Consumer Staples | 0.64% | |
| Material | 0.42% | |
| Utilities | -0.04% | |
| Real Estate | -0.28% | |
| Retail | -0.42% | |
| Communication | -1.08% | |
| Financial | -1.34% | |
| Transportation | -1.76% | |
| Industrial | -2.07% | |
| Technology | -3.78% |
📊 U.S. Sectors Performance One Month
Over the month, Healthcare again led with 9.35%, followed closely by Energy at 8.58%. The upward momentum in Material also marked a significant rebound. However, Utilities continued to be subdued with a decline of -1.93%, reflecting cautious sentiment.
| Sector | Performance (%) | Performance |
|---|---|---|
| Healthcare | 9.35% | |
| Energy | 8.58% | |
| Material | 4.89% | |
| Retail | 3.64% | |
| Consumer Staples | 2.99% | |
| Financial | 2.45% | |
| Industrial | 1.99% | |
| Technology | 1.98% | |
| Communication | 1.40% | |
| Real Estate | -0.38% | |
| Utilities | -1.93% | |
| Transportation | -2.14% |
📊 U.S. Sectors Performance Three Months
Across the three-month horizon, Healthcare significantly surged by 16.35%, while Financial outperformed with a 10.33% gain. Technology and Communication, however, faced challenges, indicating possible headwinds tied to sector-specific factors.
| Sector | Performance (%) | Performance |
|---|---|---|
| Healthcare | 16.35% | |
| Financial | 10.33% | |
| Transportation | 6.58% | |
| Industrial | 6.19% | |
| Energy | 7.29% | |
| Material | 4.79% | |
| Technology | 3.30% | |
| Retail | 2.09% | |
| Consumer Staples | 2.40% | |
| Real Estate | 1.24% | |
| Utilities | -2.69% | |
| Communication | -3.19% |
💡 Summary
In conclusion, the U.S. sector performance analysis highlights Healthcare's dominance as a consistent top performer, reflecting its defensive characteristics. Energy's resilience underscores its cyclical appeal amidst fluctuating economic conditions. Conversely, Technology and Communication sectors display volatility, warranting cautious optimism. Investors may consider strategically balancing exposure between defensive and cyclical sectors to navigate potential market intricacies effectively.
Smart Data Insight
Master the Perfect Entry & Exit for this Stock
Don't leave your profits to chance. Historically, this stock follows specific seasonal patterns that institutional traders use to maximize returns.
- ✅ Identify the "Golden Buying Window"
- ✅ Avoid high-risk correction cycles
- ✅ Backtested data from the last 20+ years