
November 19, 2026 a 09:31 am


U.S. Sectors - Performance Analysis
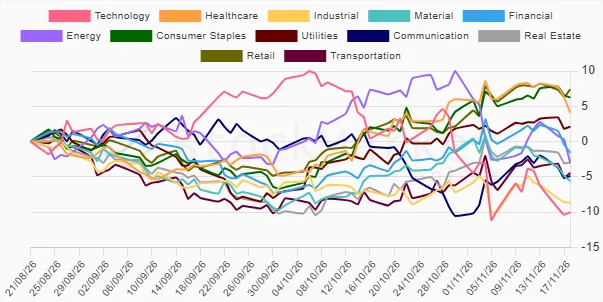
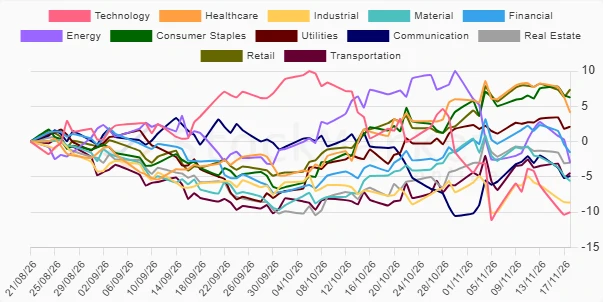
The U.S. equity sectors have demonstrated diverse performance patterns over the recent time frames of 1 week, 1 month, and 3 months. The market exhibited a mix of defensive and cyclical sector trends, with significant volatility in certain areas. In the short term, pressures were notable in Technology, while more stable sectors like Consumer Staples showed resilience.
📊 U.S. Sectors Performance One Week
The one-week performance highlights pronounced declines in the Technology and Energy sectors compared to a modest gain in Consumer Staples. This short-term view indicates a swing towards safer, defensive sectors amidst broader market volatility.
| Sector | Performance (%) | Performance |
|---|---|---|
| Consumer Staples | 0.15 | |
| Retail | -0.34 | |
| Utilities | -0.59 | |
| Transportation | -0.76 | |
| Real Estate | -1.67 | |
| Communication | -1.83 | |
| Industrial | -2.84 | |
| Financial | -3.09 | |
| Material | -3.64 | |
| Healthcare | -3.58 | |
| Energy | -4.77 | |
| Technology | -5.82 |
📊 U.S. Sectors Performance One Month
Over the one-month period, the Retail sector emerged as a leading performer, with impressive gains. Defensive sectors such as Consumer Staples, Utilities, and Retail showcased robust returns, suggesting a market preference for stability amid increasing uncertainties.
| Sector | Performance (%) | Performance |
|---|---|---|
| Retail | 4.24 | |
| Consumer Staples | 4.06 | |
| Utilities | 4.00 | |
| Transportation | 4.01 | |
| Real Estate | 3.02 | |
| Financial | 1.44 | |
| Healthcare | 0.92 | |
| Industrial | -1.03 | |
| Material | -1.34 | |
| Communication | -4.06 | |
| Energy | -9.94 | |
| Technology | -11.56 |
📊 U.S. Sectors Performance Three Months
The three-month outlook reveals substantial gains for Retail and Consumer Staples, reflecting a consumer-driven recovery focus. The ongoing struggles of Technology and Industrial sectors indicate caution towards high-growth segments.
| Sector | Performance (%) | Performance |
|---|---|---|
| Retail | 7.41 | |
| Consumer Staples | 6.25 | |
| Healthcare | 4.10 | |
| Utilities | 2.12 | |
| Financial | -1.56 | |
| Real Estate | -2.99 | |
| Energy | -2.99 | |
| Transportation | -4.45 | |
| Communication | -4.87 | |
| Material | -5.60 | |
| Industrial | -8.63 | |
| Technology | -10.02 |
🔍 Summary
The U.S. sector analysis over varying timeframes highlights the strength in traditionally defensive sectors like Retail, Consumer Staples, and Utilities, while Technology remains under pressure across all periods. Investors may wish to consider these defensive areas as safer harbors during ongoing market volatility, aligning their portfolios with more stable returns and cushioning against potential macroeconomic headwinds.
Smart Data Insight
Master the Perfect Entry & Exit for this Stock
Don't leave your profits to chance. Historically, this stock follows specific seasonal patterns that institutional traders use to maximize returns.
- ✅ Identify the "Golden Buying Window"
- ✅ Avoid high-risk correction cycles
- ✅ Backtested data from the last 20+ years