March 19, 2026 a 09:32 am


U.S. Sectors - Performance Analysis
In this analysis, we dissect the recent performance of various U.S. sectors over multiple time horizons to identify prevailing trends and dynamics. The following sections provide insights into which sectors have led the markets and which have lagged across one week, one month, and three months. This multi-temporal analysis will aid in understanding market sentiment shifts and sector resilience.
📊 U.S. Sectors Performance One Week
During the one-week period, Energy and Utilities emerged as top performers, indicating a preference for defensive and resource-based sectors. Meanwhile, Retail and Materials sectors showed marked underperformance, reflecting potential market pressures or profit-taking trends.
| Sector | Performance (%) | Performance |
|---|---|---|
| Energy | 1.59 | |
| Utilities | 0.50 | |
| Transportation | 1.19 | |
| Financial | 0.30 | |
| Technology | 0.12 | |
| Industrial | -0.03 | |
| Real Estate | -0.27 | |
| Communication | -1.39 | |
| Consumer Staples | -1.90 | |
| Healthcare | -2.02 | |
| Material | -2.42 | |
| Retail | -2.56 |
📊 U.S. Sectors Performance One Month
In the one-month span, Energy stood out with significant gains, showcasing its defensive characteristic amid a corrective phase for most sectors, including Materials and Transportation, which lagged considerably.
| Sector | Performance (%) | Performance |
|---|---|---|
| Energy | 8.47 | |
| Utilities | 0.83 | |
| Communication | -0.57 | |
| Technology | -0.91 | |
| Real Estate | -4.42 | |
| Retail | -4.83 | |
| Industrial | -5.69 | |
| Financial | -6.23 | |
| Consumer Staples | -6.40 | |
| Healthcare | -6.63 | |
| Material | -8.23 | |
| Transportation | -8.41 |
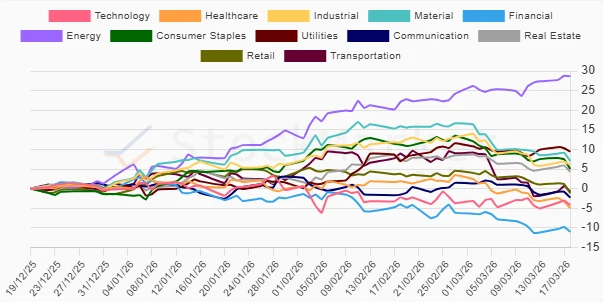
📊 U.S. Sectors Performance Three Months
Over the course of three months, Energy sector's substantial rise signifies continued investor confidence in commodities and energy-related stocks. Conversely, the evident decline in Financial sector highlights potential market vulnerabilities in that domain.
| Sector | Performance (%) | Performance |
|---|---|---|
| Energy | 28.64 | |
| Utilities | 9.45 | |
| Material | 7.07 | |
| Industrial | 6.11 | |
| Consumer Staples | 5.04 | |
| Real Estate | 4.29 | |
| Transportation | -0.71 | |
| Retail | -1.16 | |
| Communication | -2.28 | |
| Technology | -4.18 | |
| Healthcare | -4.96 | |
| Financial | -10.99 |
🔍 Summary
The analysis across the three time frames clearly indicates the dominance of the Energy sector given its robust performance, serving as a safe haven amid broader market volatility. Meanwhile, sectors like Financials and Materials have suffered, likely due to economic sensitivities and market corrections. Combining these insights, investors might consider maintaining a balanced portfolio with strategic allocation towards defensive sectors like Utilities and Energy to hedge against potential market downturns.
Smart Data Insight
Master the Perfect Entry & Exit for this Stock
Don't leave your profits to chance. Historically, this stock follows specific seasonal patterns that institutional traders use to maximize returns.
- ✅ Identify the "Golden Buying Window"
- ✅ Avoid high-risk correction cycles
- ✅ Backtested data from the last 20+ years