
June 18, 2026 a 09:31 am


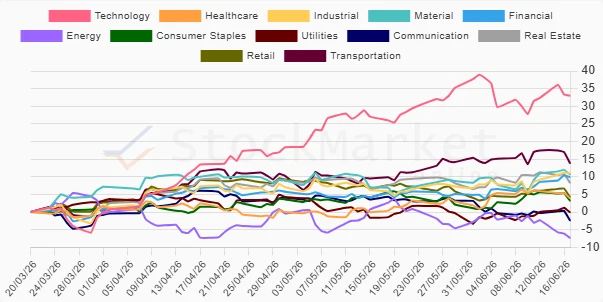
U.S. Sectors - Performance Analysis
Analyzing the performance of U.S. sectors reveals dynamic shifts in market sentiment over different time frames. While certain sectors exhibit robust growth, others face significant headwinds. Understanding these trends is crucial for informed investment decisions, highlighting the importance of distinguishing between cyclical and defensive sectors amid ever-evolving market conditions. The data underscores a blend of cautious optimism and strategic realignment.
📊 U.S. Sectors Performance One Week
| Sector | Performance (%) | Performance |
|---|---|---|
| Financial | 2.70 | |
| Industrial | 2.52 | |
| Material | 1.57 | |
| Technology | 1.52 | |
| Utilities | 0.95 | |
| Consumer Staples | -1.85 | |
| Retail | -1.91 | |
| Real Estate | -2.11 | |
| Healthcare | -2.21 | |
| Communication | -2.60 | |
| Transportation | -3.25 | |
| Energy | -4.32 |
📊 U.S. Sectors Performance One Month
| Sector | Performance (%) | Performance |
|---|---|---|
| Technology | 7.63 | |
| Industrial | 6.40 | |
| Material | 6.07 | |
| Financial | 5.70 | |
| Transportation | 4.74 | |
| Healthcare | 2.39 | |
| Utilities | 0.42 | |
| Real Estate | 0.18 | |
| Consumer Staples | -2.72 | |
| Retail | -3.28 | |
| Communication | -5.81 | |
| Energy | -11.19 |
📊 U.S. Sectors Performance Three Months
| Sector | Performance (%) | Performance |
|---|---|---|
| Technology | 32.99 | |
| Transportation | 13.79 | |
| Industrial | 11.09 | |
| Material | 10.64 | |
| Financial | 9.90 | |
| Real Estate | 8.24 | |
| Retail | 4.19 | |
| Healthcare | 3.92 | |
| Consumer Staples | 3.16 | |
| Utilities | -0.09 | |
| Communication | -2.43 | |
| Energy | -7.35 |
✅ Summary
The analysis of U.S. sector performances over varying timeframes unveils a complex financial landscape. Technology consistently emerges as a robust sector, showcasing resilience and growth, especially in the three-month analysis. Cyclical sectors like Financials and Industrials exhibit favorable one-month performance, indicating positive market sentiment towards economic recovery. Conversely, defensive sectors such as Healthcare and Consumer Staples perform moderately, reflective of their stable yet less aggressive nature in growth climates. Investors should weigh the underlying economic conditions and sector-specific influences, encouraging a balanced portfolio strategy to navigate through volatility and capitalize on growth opportunities.
Smart Data Insight
Master the Perfect Entry & Exit for this Stock
Don't leave your profits to chance. Historically, this stock follows specific seasonal patterns that institutional traders use to maximize returns.
- ✅ Identify the "Golden Buying Window"
- ✅ Avoid high-risk correction cycles
- ✅ Backtested data from the last 20+ years