
July 16, 2026 a 09:31 am

U.S. Sectors - Performance Analysis
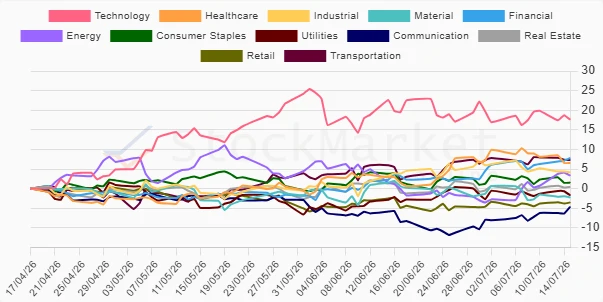
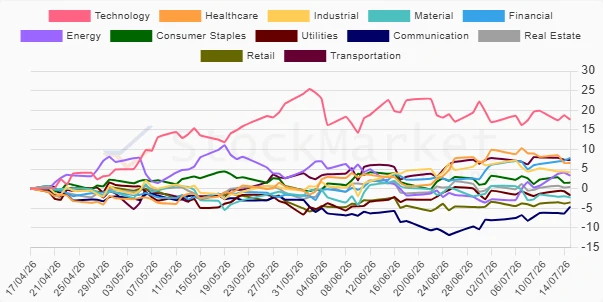
📊 The U.S. sectors have shown varied performances over the past week, month, and quarter. Notably, certain sectors such as Technology and Financial have experienced significant volatility, while Energy and Healthcare have shown resilience and strong growth over the recent short-term periods. This analysis will delve into the performance of each sector, identifying top performers, underperformers, and emerging trends.
U.S. Sectors Performance One Week
| Sector | Performance (%) | Performance |
|---|---|---|
| Energy | 3.06 | |
| Communication | 2.58 | |
| Financial | 1.84 | |
| Retail | 0.98 | |
| Real Estate | 0.75 | |
| Material | 0.48 | |
| Consumer Staples | 0.35 | |
| Utilities | 0.20 | |
| Industrial | -0.58 | |
| Transportation | -0.72 | |
| Technology | -2.01 | |
| Healthcare | -2.40 |
U.S. Sectors Performance One Month
| Sector | Performance (%) | Performance |
|---|---|---|
| Financial | 4.07 | |
| Healthcare | 3.61 | |
| Energy | 2.21 | |
| Transportation | 1.80 | |
| Communication | 1.08 | |
| Utilities | 0.41 | |
| Industrial | 0.23 | |
| Real Estate | -1.10 | |
| Retail | -1.14 | |
| Consumer Staples | -2.35 | |
| Technology | -2.21 | |
| Material | -4.18 |
U.S. Sectors Performance Three Months
| Sector | Performance (%) | Performance |
|---|---|---|
| Technology | 17.60 | |
| Financial | 7.80 | |
| Transportation | 7.30 | |
| Healthcare | 6.54 | |
| Industrial | 4.16 | |
| Energy | 3.34 | |
| Consumer Staples | 1.54 | |
| Real Estate | 0.44 | |
| Utilities | -1.70 | |
| Material | -2.25 | |
| Retail | -3.53 | |
| Communication | -4.64 |
Summary
💡 In summary, the U.S. sectors displayed a spectrum of performance over varied timeframes. Over the past week, Energy and Communication outperformed indicating a potential short-term shift towards these sectors. Financial sectors shone in the one-month period, possibly reflecting optimistic economic indicators or policy changes. The Technology sector’s robust performance over the quarter highlights continued innovation and market strength. Portfolio adjustments emphasizing Energy, Technology, and Financial sectors might be prudent, depending on the risk appetite and strategic outlook.
Smart Data Insight
Master the Perfect Entry & Exit for this Stock
Don't leave your profits to chance. Historically, this stock follows specific seasonal patterns that institutional traders use to maximize returns.
- ✅ Identify the "Golden Buying Window"
- ✅ Avoid high-risk correction cycles
- ✅ Backtested data from the last 20+ years