
October 15, 2026 a 09:32 am


U.S. Sectors - Performance Analysis
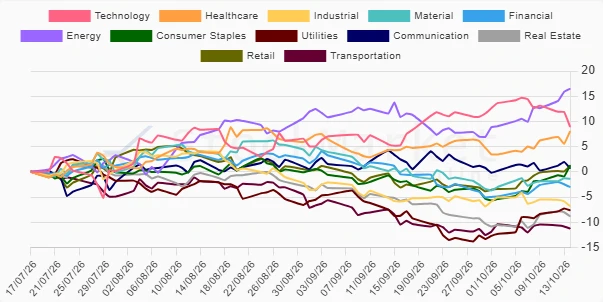
In recent times, the U.S. sector performances have been marked by contrasting trends across different time frames, with significant variations between defensive and cyclical sectors. This analysis delves into how these sectors have performed over the last week, month, and three months. The energy sector emerges as a dominant force over the three-month period, while the technology sector shows resilience on a monthly basis. Let's explore the nuances of sectorial movements to better understand market dynamics.
📊 U.S. Sectors Performance One Week
| Sector | Performance (%) | Performance |
|---|---|---|
| Energy | 3.62 | |
| Healthcare | 3.45 | |
| Consumer Staples | 3.14 | |
| Retail | 1.94 | |
| Real Estate | 1.59 | |
| Utilities | 1.58 | |
| Material | 0.81 | |
| Financial | 0.53 | |
| Transportation | -0.54 | |
| Industrial | -0.81 | |
| Communication | -1.10 | |
| Technology | -3.73 |
📊 U.S. Sectors Performance One Month
| Sector | Performance (%) | Performance |
|---|---|---|
| Healthcare | 3.79 | |
| Technology | 3.74 | |
| Retail | 3.32 | |
| Consumer Staples | 2.84 | |
| Energy | 2.76 | |
| Utilities | 1.09 | |
| Industrial | -1.01 | |
| Material | -2.04 | |
| Transportation | -2.81 | |
| Communication | -2.69 | |
| Real Estate | -3.64 | |
| Financial | -4.14 |
📊 U.S. Sectors Performance Three Months
| Sector | Performance (%) | Performance |
|---|---|---|
| Energy | 16.50 | |
| Technology | 8.89 | |
| Healthcare | 8.08 | |
| Consumer Staples | 1.28 | |
| Communication | 0.67 | |
| Retail | 1.17 | |
| Material | -1.38 | |
| Financial | -3.01 | |
| Industrial | -6.82 | |
| Utilities | -7.63 | |
| Real Estate | -8.83 | |
| Transportation | -11.27 |
✅ Summary
The analysis reveals that the energy sector has been a standout performer over the three-month period, indicating a robust demand perhaps driven by macroeconomic factors such as supply constraints or geopolitical tensions. Technology also demonstrates significant strength, particularly on a monthly basis, signaling resilience amidst market volatility. Conversely, sectors like real estate and transportation underperform consistently, reflecting potential vulnerabilities to interest rate changes and economic slowdown respectively. Investors might consider a cautious yet optimistic approach, balancing exposure between robust performers and undervalued sectors.
Smart Data Insight
Master the Perfect Entry & Exit for this Stock
Don't leave your profits to chance. Historically, this stock follows specific seasonal patterns that institutional traders use to maximize returns.
- ✅ Identify the "Golden Buying Window"
- ✅ Avoid high-risk correction cycles
- ✅ Backtested data from the last 20+ years