November 13, 2025 a 09:32 am


U.S. Sectors - Performance Analysis
📊 The U.S. sectors have demonstrated varied performance over the past week, month, and quarter, reflecting broader market conditions and sector-specific influences. This analysis provides insights into the sectors that have outperformed or underperformed across these timeframes and discusses the implications for investors.
U.S. Sectors Performance One Week 📈
| Sector | Performance (%) | Performance |
|---|---|---|
| Healthcare | 4.65 | |
| Material | 3.89 | |
| Transportation | 2.69 | |
| Financial | 2.38 | |
| Consumer Staples | 2.27 | |
| Energy | 2.25 | |
| Utilities | 1.65 | |
| Technology | 1.67 | |
| Industrial | 1.18 | |
| Retail | 1.48 | |
| Real Estate | 1.59 | |
| Communication | 1.01 |
U.S. Sectors Performance One Month 📊
| Sector | Performance (%) | Performance |
|---|---|---|
| Healthcare | 7.15 | |
| Technology | 4.48 | |
| Energy | 4.48 | |
| Transportation | 2.75 | |
| Retail | 2.41 | |
| Financial | 0.88 | |
| Industrial | 0.80 | |
| Real Estate | 0.30 | |
| Communication | -0.88 | |
| Utilities | -1.91 | |
| Material | -0.99 | |
| Consumer Staples | -2.20 |
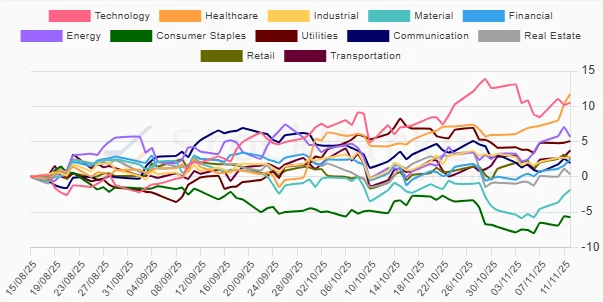
U.S. Sectors Performance Three Months 🔍
| Sector | Performance (%) | Performance |
|---|---|---|
| Healthcare | 11.74 | |
| Technology | 10.51 | |
| Energy | 5.68 | |
| Utilities | 5.06 | |
| Transportation | 3.73 | |
| Retail | 2.63 | |
| Industrial | 2.80 | |
| Financial | 2.47 | |
| Communication | 1.98 | |
| Real Estate | 0.36 | |
| Material | -1.86 | |
| Consumer Staples | -5.72 |
Summary ✅
💡 Across all timeframes, Healthcare consistently emerges as a top-performing sector, suggesting a robust demand in this defensive space. Technology also shows strong performance, particularly over the three-month period, underscoring its ongoing resilience and growth potential. Consumer Staples, typically considered a safe harbor during market volatility, surprisingly underperformed, particularly over the three-month period. As investors digest these performances, the data suggests an environment where sector-specific strategies may yield the most effective results.
Smart Data Insight
Master the Perfect Entry & Exit for this Stock
Don't leave your profits to chance. Historically, this stock follows specific seasonal patterns that institutional traders use to maximize returns.
- ✅ Identify the "Golden Buying Window"
- ✅ Avoid high-risk correction cycles
- ✅ Backtested data from the last 20+ years