March 12, 2026 a 09:32 am


U.S. Sectors - Performance Analysis
The performance of U.S. sectors over different timeframes reveals diverse trends and stark contrasts between cyclical and defensive sectors. Energy stands out with strong performance across multiple periods, likely driven by fluctuating oil prices. Other sectors exhibit mixed results reflecting broader market uncertainties and macroeconomic influences.
U.S. Sectors Performance One Week
📊 In the past week, the Energy sector outperformed significantly with a notable gain, contrasting starkly against the Transportation and Financial sectors which faced substantial declines. The varied performance indicates market volatility with defensive sectors like Consumer Staples underperforming potentially due to broader economic concerns.
| Sector | Performance (%) | Performance |
|---|---|---|
| Energy | 0.92 | |
| Technology | 0.22 | |
| Healthcare | -0.69 | |
| Consumer Staples | -0.96 | |
| Communication | -1.21 | |
| Retail | -1.25 | |
| Industrial | -1.49 | |
| Utilities | -1.56 | |
| Material | -1.95 | |
| Real Estate | -2.16 | |
| Financial | -3.14 | |
| Transportation | -4.06 |
U.S. Sectors Performance One Month
📈 Within a month, Energy has surged, reflecting its fundamental strength, whereas cyclical sectors like Transportation struggled significantly. Defensive sectors showed resilience, as seen in Utilities, highlighting a shift towards safer assets amid prolonged volatility.
| Sector | Performance (%) | Performance |
|---|---|---|
| Energy | 6.33 | |
| Utilities | 4.48 | |
| Communication | -0.42 | |
| Real Estate | -0.96 | |
| Retail | -1.18 | |
| Technology | -1.34 | |
| Healthcare | -1.54 | |
| Industrial | -2.48 | |
| Consumer Staples | -2.87 | |
| Material | -5.85 | |
| Financial | -7.42 | |
| Transportation | -7.79 |
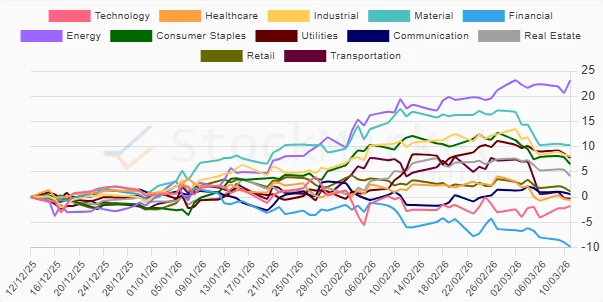
U.S. Sectors Performance Three Months
📉 Over the last three months, the surge in Energy and Material sectors underscores a potential strategic shift towards raw commodities. On the contrary, Financials struggled substantially, indicating investor apprehensions in the financial market amid macroeconomic pressures.
| Sector | Performance (%) | Performance |
|---|---|---|
| Energy | 23.13 | |
| Material | 10.29 | |
| Industrial | 8.11 | |
| Utilities | 7.79 | |
| Consumer Staples | 6.54 | |
| Real Estate | 4.17 | |
| Retail | 1.12 | |
| Communication | 0.57 | |
| Healthcare | -0.59 | |
| Transportation | -0.28 | |
| Technology | -1.77 | |
| Financial | -9.86 |
Summary
🗣️ In summary, the U.S. sector performance exhibits a pronounced divergence primarily influenced by economic conditions and sector-specific dynamics. Energy's consistent strength across all timeframes suggests enduring demand and price recovery. Conversely, the underperformance of Financials reflects heightened market risks. Defensive sectors such as Utilities have shown resilience amidst market volatility, hinting at a cautious investor sentiment. For strategic positioning, broad exposure to both cyclical growth in Energy and the stability of defensive Utilities could offer balanced potential in navigating current market conditions.