December 11, 2025 a 09:32 am


U.S. Sectors - Performance Analysis
📊 The recent performance data across key U.S. sectors reveal dynamic shifts over different periods. Short-term fluctuations highlight both opportunities and risks, while mid- to long-term trends suggest evolving market narratives. By considering both defensive and cyclical sectors, we aim to provide a comprehensive analysis.
U.S. Sectors Performance One Week 📈
The one-week data presents a mixed bag of sector performances, driven by varying market sentiments. Technology leads with a strong uptick, likely driven by robust earnings reports. Defensive sectors like Healthcare and Utilities faced downward pressure, indicating a potential rotation into more cyclical assets.
| Sector | Performance (%) | Performance |
|---|---|---|
| Technology | 2.17 | |
| Communication | 1.11 | |
| Industrial | 0.70 | |
| Transportation | 0.60 | |
| Financial | 0.44 | |
| Retail | 0.38 | |
| Energy | 0.17 | |
| Material | 0.03 | |
| Consumer Staples | -0.30 | |
| Real Estate | -1.02 | |
| Healthcare | -1.13 | |
| Utilities | -2.26 |
U.S. Sectors Performance One Month 📈
One-month data suggests that Transport and Communication sectors have exhibited strong growth, potentially capitalizing on economic recovery narratives. Utilities faced persistent declines, hinting at a broader reallocation of resources away from defensive sectors.
| Sector | Performance (%) | Performance |
|---|---|---|
| Transportation | 4.83 | |
| Communication | 2.54 | |
| Financial | 1.35 | |
| Industrial | 1.27 | |
| Material | 1.19 | |
| Technology | 1.65 | |
| Energy | 1.00 | |
| Healthcare | 1.06 | |
| Consumer Staples | 1.05 | |
| Retail | -0.33 | |
| Real Estate | -2.66 | |
| Utilities | -4.80 |
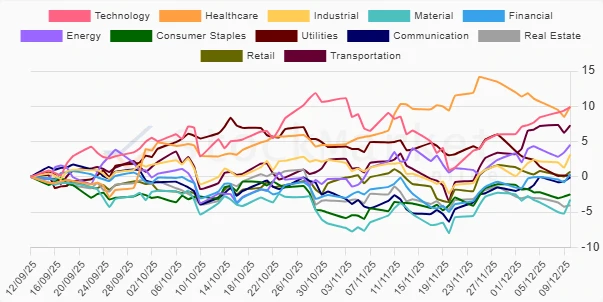
U.S. Sectors Performance Three Months 📉
Over three months, Healthcare and Technology sectors demonstrate significant gains, suggesting sustained investor confidence in growth-themed investments. Declines in Material and Real Estate reflect challenges within traditional sectors amid changing market dynamics.
| Sector | Performance (%) | Performance |
|---|---|---|
| Healthcare | 9.95 | |
| Technology | 9.87 | |
| Transportation | 7.29 | |
| Energy | 4.52 | |
| Industrial | 3.14 | |
| Retail | 0.73 | |
| Financial | 0.38 | |
| Utilities | 0.15 | |
| Communication | -0.07 | |
| Consumer Staples | -2.50 | |
| Material | -3.25 | |
| Real Estate | -4.03 |
Summary 🗣️
💡 The U.S. sector performance over various periods suggests a complex interplay between market forces and sector-specific dynamics. While growth sectors, especially Technology and Healthcare, are soaring, traditional sectors face challenges. A strategic focus on diversified portfolios balancing cyclical and defensive assets could be beneficial as the market adapts to new economic realities.
Smart Data Insight
Master the Perfect Entry & Exit for this Stock
Don't leave your profits to chance. Historically, this stock follows specific seasonal patterns that institutional traders use to maximize returns.
- ✅ Identify the "Golden Buying Window"
- ✅ Avoid high-risk correction cycles
- ✅ Backtested data from the last 20+ years