
April 09, 2026 a 09:31 am


U.S. Sectors - Performance Analysis
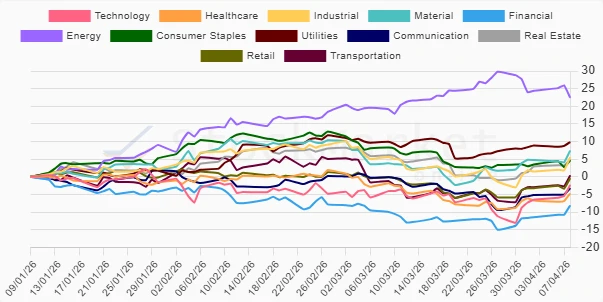
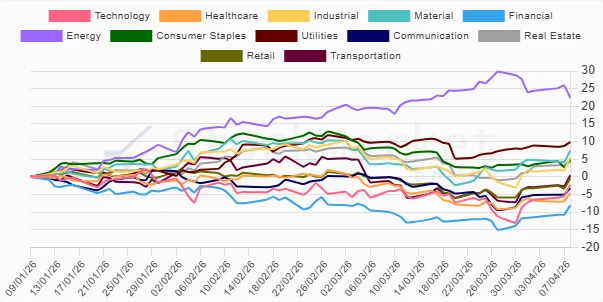
In an ever-changing financial landscape, the performance analysis of U.S. sectors over varying timeframes provides crucial insights into market dynamics. Over the last three months, sectors such as Energy have witnessed significant growth, whereas others, like Financial, have faced challenges. Understanding these trends is essential for informed investment strategies.
U.S. Sectors Performance One Week
📊 The one-week snapshot indicates a robust rally in Technology and Industrial sectors, reflecting a positive market sentiment. However, the Energy sector faced headwinds, indicating potential volatility or corrective movement. Most defensive sectors showed moderate gains, highlighting investor confidence. 📈
| Sector | Performance (%) | Performance |
|---|---|---|
| Technology | 4.16% | |
| Industrial | 4.06% | |
| Financial | 3.36% | |
| Transportation | 3.31% | |
| Retail | 2.78% | |
| Material | 2.67% | |
| Real Estate | 1.99% | |
| Healthcare | 1.96% | |
| Communication | 1.88% | |
| Consumer Staples | 1.12% | |
| Utilities | 0.95% | |
| Energy | -1.98% |
U.S. Sectors Performance One Month
🔍 Over the one-month period, the Energy sector took the lead, driven by factors that could include rising oil prices or geopolitical instability. Traditional defensive sectors like Consumer Staples and Healthcare underperformed, which might indicate shifting investor sentiment toward growth sectors. 📉
| Sector | Performance (%) | Performance |
|---|---|---|
| Energy | 4.56% | |
| Material | 3.83% | |
| Transportation | 2.75% | |
| Financial | 2.38% | |
| Technology | 1.72% | |
| Utilities | 0.56% | |
| Industrial | 0.48% | |
| Retail | -0.11% | |
| Real Estate | -1.01% | |
| Communication | -2.95% | |
| Healthcare | -2.20% | |
| Consumer Staples | -3.40% |
U.S. Sectors Performance Three Months
⚠️ In the past three months, the Energy sector emerged as a substantial outperformer, primarily due to macroeconomic factors such as energy demand recovery. Contrarily, Financials lagged significantly, reflecting possible concerns over interest rates or financial stability issues. The relative outperformance of defensive Utilities suggests investor caution amidst broader market uncertainty. 📉
| Sector | Performance (%) | Performance |
|---|---|---|
| Energy | 22.44% | |
| Utilities | 9.86% | |
| Material | 7.43% | |
| Real Estate | 4.94% | |
| Consumer Staples | 4.62% | |
| Industrial | 5.57% | |
| Transportation | 0.39% | |
| Retail | -0.43% | |
| Technology | -2.32% | |
| Communication | -3.25% | |
| Healthcare | -4.74% | |
| Financial | -8.10% |
Summary
✅ Overall, the recent sector performance analysis underscores the resurgence of cyclical sectors, particularly Energy, driven by economic recovery and increased demand. In contrast, defensive sectors have shown mixed results, reflective of investor eagerness to capitalize on growth opportunities while maintaining caution due to global uncertainties. Going forward, staying agile and well-diversified will be key as market sentiments fluctuate.
Smart Data Insight
Master the Perfect Entry & Exit for this Stock
Don't leave your profits to chance. Historically, this stock follows specific seasonal patterns that institutional traders use to maximize returns.
- ✅ Identify the "Golden Buying Window"
- ✅ Avoid high-risk correction cycles
- ✅ Backtested data from the last 20+ years