
October 08, 2026 a 09:31 am

U.S. Sectors - Performance Analysis
The financial landscape across various U.S. sectors has demonstrated varied performance over short and mid-term durations. In recent weeks, defensive sectors have held relatively stable, while cyclicals show fluctuations. As market dynamics evolve, investors should maintain a balanced portfolio approach to align with emerging trends and economic signals.
📊 U.S. Sectors Performance One Week
| Sector | Performance (%) | Performance |
|---|---|---|
| Utilities | 3.69% | |
| Retail | 1.89% | |
| Technology | 1.80% | |
| Consumer Staples | 1.70% | |
| Energy | 1.05% | |
| Communication | 1.21% | |
| Material | 0.92% | |
| Healthcare | 1.57% | |
| Financial | 0.55% | |
| Transportation | -0.14% | |
| Real Estate | -0.25% | |
| Industrial | -0.44% |
📊 U.S. Sectors Performance One Month
| Sector | Performance (%) | Performance |
|---|---|---|
| Technology | 7.07% | |
| Healthcare | 1.07% | |
| Communication | -0.06% | |
| Retail | -1.34% | |
| Consumer Staples | -2.73% | |
| Energy | -2.03% | |
| Utilities | -5.30% | |
| Material | -5.78% | |
| Transportation | -4.94% | |
| Industrial | -3.75% | |
| Financial | -6.34% | |
| Real Estate | -7.82% |
📊 U.S. Sectors Performance Three Months
| Sector | Performance (%) | Performance |
|---|---|---|
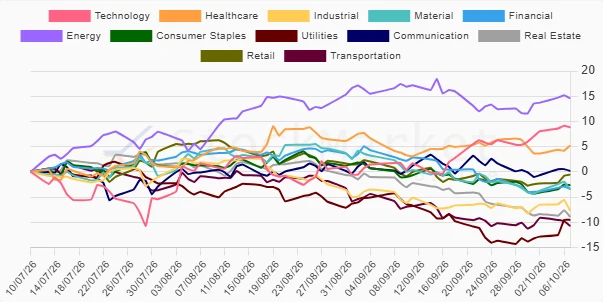
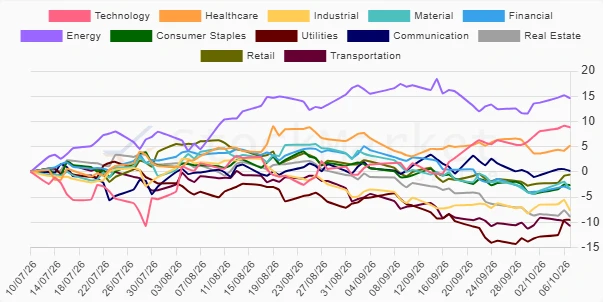
| Energy | 14.58% | |
| Technology | 8.84% | |
| Healthcare | 5.22% | |
| Communication | 0.18% | |
| Retail | -0.56% | |
| Consumer Staples | -2.65% | |
| Financial | -3.42% | |
| Material | -3.49% | |
| Industrial | -7.73% | |
| Real Estate | -8.93% | |
| Utilities | -9.55% | |
| Transportation | -10.75% |
💡 Summary
Over the recent analysis periods, the U.S. sectors have displayed significant volatility. The Energy sector outperformed substantially over the three-months duration due to underlying commodity price increases. Conversely, defensive sectors like Utilities and Real Estate have struggled, facing persistent bearish trends over longer periods. Investors should thus be cognizant of cyclical fluctuations and positioning based on sector performance to better navigate market uncertainties.
Smart Data Insight
Master the Perfect Entry & Exit for this Stock
Don't leave your profits to chance. Historically, this stock follows specific seasonal patterns that institutional traders use to maximize returns.
- ✅ Identify the "Golden Buying Window"
- ✅ Avoid high-risk correction cycles
- ✅ Backtested data from the last 20+ years