November 06, 2025 a 09:32 am


U.S. Sectors - Performance Analysis
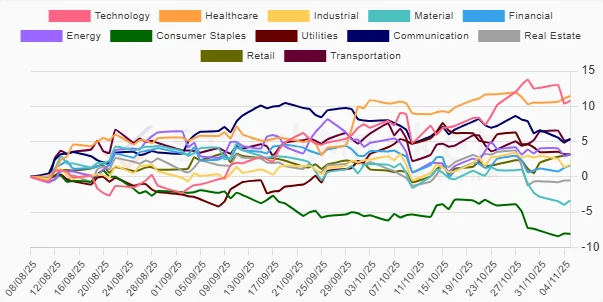
Over the past quarters, we have observed dynamic shifts in sector performances among U.S. equities. Factors including policy changes, consumer sentiment, and global economic conditions have shaped these trends. A careful evaluation reveals differing resilience levels between defensive and cyclical sectors, meriting a comprehensive assessment to identify outperformers and areas of concern.
📊 U.S. Sectors Performance One Week
| Sector | Performance (%) | Performance |
|---|---|---|
| Retail | 2.65 | |
| Healthcare | 0.95 | |
| Financial | 0.71 | |
| Real Estate | 0.13 | |
| Transportation | 0.05 | |
| Energy | -0.08 | |
| Consumer Staples | -0.74 | |
| Communication | -0.78 | |
| Industrial | -0.96 | |
| Utilities | -0.97 | |
| Material | -1.10 | |
| Technology | -1.74 |
📊 U.S. Sectors Performance One Month
| Sector | Performance (%) | Performance |
|---|---|---|
| Technology | 3.49 | |
| Retail | 2.51 | |
| Healthcare | 1.00 | |
| Utilities | -1.44 | |
| Real Estate | -1.34 | |
| Industrial | -0.58 | |
| Transportation | -0.64 | |
| Financial | -2.10 | |
| Energy | -2.22 | |
| Communication | -2.23 | |
| Consumer Staples | -2.84 | |
| Material | -4.68 |
📊 U.S. Sectors Performance Three Months
| Sector | Performance (%) | Performance |
|---|---|---|
| Healthcare | 11.47 | |
| Technology | 10.78 | |
| Communication | 5.40 | |
| Transportation | 5.25 | |
| Energy | 3.22 | |
| Utilities | 3.21 | |
| Retail | 3.17 | |
| Industrial | 1.77 | |
| Financial | 1.63 | |
| Real Estate | -0.53 | |
| Material | -3.35 | |
| Consumer Staples | -8.09 |
🗣️ Summary
Across various periods, defensive sectors such as Healthcare have showcased resilience, outperforming during shorter time frames and maintaining growth over extended periods. Technology remains a strong contender by delivering substantial gains across all durations, underscoring its pivotal role in economic recovery and expansion trends. Cyclical sectors, despite volatility, present opportunities as growth rebounds. Investors should maintain a balanced approach to harness these growth dynamics while managing risk exposures effectively.
Smart Data Insight
Master the Perfect Entry & Exit for this Stock
Don't leave your profits to chance. Historically, this stock follows specific seasonal patterns that institutional traders use to maximize returns.
- ✅ Identify the "Golden Buying Window"
- ✅ Avoid high-risk correction cycles
- ✅ Backtested data from the last 20+ years