
August 06, 2026 a 09:32 am

📊 U.S. Sectors - Performance Analysis
The U.S. sectors have shown varied performance over the past weeks and months, reflecting the dynamic nature of the financial markets. While certain sectors have thrived, others have faced challenges, notably between defensive and cyclical sectors. This analysis delves into the nuanced performance of these sectors over three distinct timelines: one week, one month, and three months.
📈 U.S. Sectors Performance One Week
| Sector | Performance (%) | Performance |
|---|---|---|
| Technology | 5.76 | |
| Retail | 4.58 | |
| Industrial | 4.40 | |
| Communication | 4.01 | |
| Transportation | 2.24 | |
| Material | 1.98 | |
| Financial | 1.74 | |
| Healthcare | 0.40 | |
| Consumer Staples | -0.16 | |
| Real Estate | -0.22 | |
| Utilities | -2.25 | |
| Energy | -2.81 |
📈 U.S. Sectors Performance One Month
| Sector | Performance (%) | Performance |
|---|---|---|
| Retail | 5.59 | |
| Energy | 4.96 | |
| Technology | 4.19 | |
| Financial | 3.50 | |
| Material | 2.34 | |
| Industrial | 2.29 | |
| Real Estate | 0.76 | |
| Consumer Staples | 0.71 | |
| Communication | 0.11 | |
| Healthcare | -0.04 | |
| Transportation | -0.33 | |
| Utilities | -4.49 |
📈 U.S. Sectors Performance Three Months
| Sector | Performance (%) | Performance |
|---|---|---|
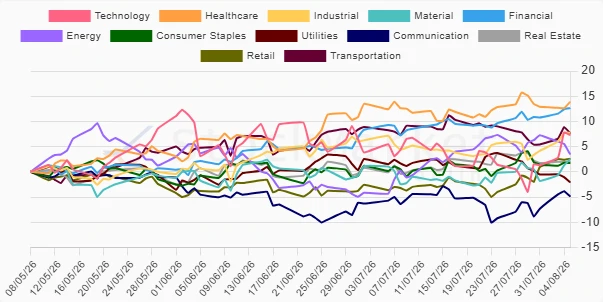
| Healthcare | 13.88 | |
| Financial | 12.62 | |
| Industrial | 7.75 | |
| Technology | 7.28 | |
| Transportation | 7.64 | |
| Retail | 2.58 | |
| Material | 2.51 | |
| Real Estate | 2.02 | |
| Energy | 3.46 | |
| Consumer Staples | 1.75 | |
| Utilities | -2.09 | |
| Communication | -4.88 |
🔍 Summary
In summary, the recent performance trends highlight several key observations in the U.S. sectors. Over the one-week period, Technology and Retail sectors drove significant gains, pointing to a resurgence in consumer demand and digital advancement. The monthly and three-month analysis reflects a robust performance from traditionally defensive sectors such as Healthcare, underscoring increased market defenses during periods of volatility. Contrarily, Utilities and Communication sectors depicted weaker performance, perhaps due to evolving energy dynamics and communication challenges. Investors should consider balancing growth and value strategies, leveraging the insights from cyclical performance variances for strategic asset allocation.
Smart Data Insight
Master the Perfect Entry & Exit for this Stock
Don't leave your profits to chance. Historically, this stock follows specific seasonal patterns that institutional traders use to maximize returns.
- ✅ Identify the "Golden Buying Window"
- ✅ Avoid high-risk correction cycles
- ✅ Backtested data from the last 20+ years