March 05, 2026 a 09:32 am


U.S. Sectors - Performance Analysis
In this comprehensive analysis, we delve into the performance dynamics of U.S. sectors over varying timeframes of one week, one month, and three months. By evaluating both defensive and cyclical sectors, our goal is to uncover underlying trends that might indicate future sector leadership or risk. Through detailed data examination, we identify top-performing sectors alongside those lagging, equipping investors with insights to refine their strategies.
U.S. Sectors Performance One Week 📊
This week's market performance data illustrates a mixed scenario across sectors. Defensive sectors, such as Utilities, showed resilience, while cyclical sectors witnessed variability. Notably, the Energy sector led the gains, yielding a 2.09% increase, whereas Materials were the major laggards, dropping by 2.03%.
| Sector | Performance (%) | Performance |
|---|---|---|
| Energy | 2.09 | |
| Communication | 1.77 | |
| Retail | 1.25 | |
| Real Estate | 0.30 | |
| Utilities | 0.21 | |
| Healthcare | -0.20 | |
| Industrial | -0.39 | |
| Transportation | -0.75 | |
| Technology | -0.80 | |
| Consumer Staples | -1.90 | |
| Financial | -1.90 | |
| Material | -2.03 |
U.S. Sectors Performance One Month 📈
Over the last month, the Utilities sector emerged as the leading performer with a 9.04% gain, highlighting the strength of defensive sectors. In contrast, the Financial sector faced the largest setbacks, decreasing by 3.69%, indicating potential vulnerabilities in financial markets.
| Sector | Performance (%) | Performance |
|---|---|---|
| Utilities | 9.04 | |
| Energy | 8.58 | |
| Real Estate | 7.06 | |
| Industrial | 4.18 | |
| Material | 2.57 | |
| Transportation | 2.47 | |
| Healthcare | 1.98 | |
| Consumer Staples | 1.59 | |
| Communication | 0.95 | |
| Retail | -0.85 | |
| Technology | -1.32 | |
| Financial | -3.69 |
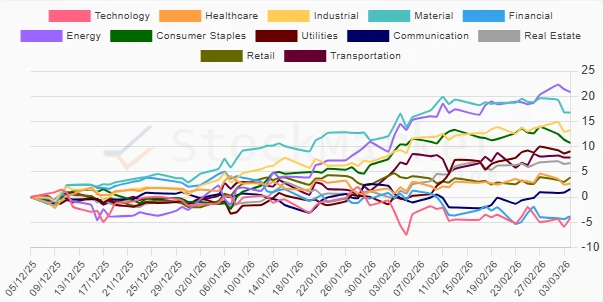
U.S. Sectors Performance Three Months 📉
Looking back over three months, Energy-driven sectors surged with Energy showing an impressive 20.81% increase. Defensive sectors, although performing well, couldn't match the magnitude. Material also saw strong growth with a remarkable 16.77%, indicating renewed interest in industrial inputs.
| Sector | Performance (%) | Performance |
|---|---|---|
| Energy | 20.81 | |
| Material | 16.77 | |
| Industrial | 13.24 | |
| Consumer Staples | 10.73 | |
| Utilities | 9.05 | |
| Transportation | 7.82 | |
| Real Estate | 6.71 | |
| Retail | 3.86 | |
| Healthcare | 2.65 | |
| Communication | 1.58 | |
| Financial | -3.83 | |
| Technology | -4.19 |
Summary 💡
In summary, over the past three months, Energy and Materials have demonstrated robust performance, highlighting potential for sector-specific gains amidst broader market volatility. While traditional safe havens like Utilities performed consistently well, cyclical sectors, particularly Financials and Technology, have shown significant challenges. Investors may consider an overweight positioning in resilient sectors whilst cautiously monitoring the recovery trajectory in underperforming areas.
Smart Data Insight
Master the Perfect Entry & Exit for this Stock
Don't leave your profits to chance. Historically, this stock follows specific seasonal patterns that institutional traders use to maximize returns.
- ✅ Identify the "Golden Buying Window"
- ✅ Avoid high-risk correction cycles
- ✅ Backtested data from the last 20+ years