February 05, 2026 a 09:32 am


U.S. Sectors - Performance Analysis
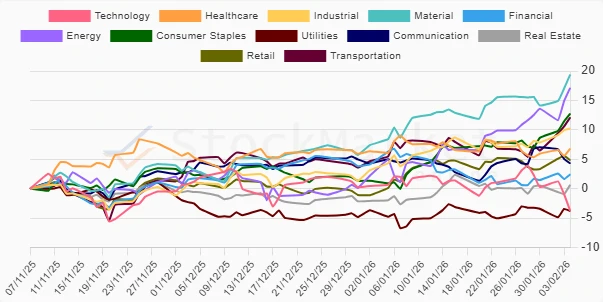
📊 In the ever-evolving financial landscape of U.S. sectors, recent performance metrics provide insightful perspectives. The past week, month, and three months have revealed contrasting narratives across various sectors, influenced by macroeconomic factors and investor sentiment. While certain defensive sectors showed resilience, cyclical sectors exhibited significant volatility. Understanding these shifts can guide strategic investment decisions.
U.S. Sectors Performance One Week
📈 Over the past week, the sectorial performance was mixed, with notable strength in the Consumer Staples and Energy sectors, each showing appreciable returns. The Technology sector, however, lagged significantly, indicating potential investor rotation from growth to defensive plays. Interestingly, cyclical sectors like Industrial and Material also edged higher, potentially reflecting optimism in broader economic conditions.
| Sector | Performance (%) | Performance |
|---|---|---|
| Consumer Staples | 5.79 | |
| Energy | 4.60 | |
| Transportation | 4.75 | |
| Material | 3.77 | |
| Industrial | 2.12 | |
| Retail | 1.58 | |
| Healthcare | 1.44 | |
| Real Estate | 0.24 | |
| Financial | 0.76 | |
| Utilities | -0.56 | |
| Communication | -2.51 | |
| Technology | -6.06 |
U.S. Sectors Performance One Month
📈 In the one-month sector performance, Energy emerged as a clear leader, underscoring its robust rebound. The Consumer Staples and Material sectors followed, illustrating the blend of defensive and cyclical strengths. Technology and Financials showed weakness, reflecting investor caution in growth and economically sensitive domains.
| Sector | Performance (%) | Performance |
|---|---|---|
| Energy | 14.88 | |
| Consumer Staples | 11.69 | |
| Material | 8.98 | |
| Industrial | 4.55 | |
| Transportation | 4.10 | |
| Retail | 3.30 | |
| Real Estate | 1.93 | |
| Utilities | 0.50 | |
| Communication | -0.37 | |
| Healthcare | -1.26 | |
| Financial | -4.35 | |
| Technology | -5.81 |
U.S. Sectors Performance Three Months
📈 The three-month analysis spotlighted the Material and Energy sectors as standout performers, reflecting bullish trends possibly due to supply-demand dynamics and geopolitical influences. Consumer Staples and Transportation sectors also performed robustly. Technology underperformance suggests continued volatility, likely due to macroeconomic pressures such as interest rate adjustments.
| Sector | Performance (%) | Performance |
|---|---|---|
| Material | 19.37 | |
| Energy | 17.13 | |
| Consumer Staples | 12.74 | |
| Transportation | 12.10 | |
| Industrial | 10.22 | |
| Healthcare | 6.78 | |
| Retail | 4.83 | |
| Communication | 4.27 | |
| Transportation | 2.42 | |
| Real Estate | 0.63 | |
| Utilities | -3.81 | |
| Technology | -3.75 |
Summary
🔍 In summary, the U.S. sector performance analysis reveals that while defensive sectors offered stability, cyclical ones provided opportunities for higher returns under specific market conditions. Energy and Material sectors consistently stood out across different periods, reflecting strong macroeconomic and geopolitical currents. In contrast, Technology's underperformance suggests a recalibration within growth-focused investments. 📈 For future allocations, investors may consider diversifying across these burgeoning sectors while maintaining caution in overextended growth domains.
Smart Data Insight
Master the Perfect Entry & Exit for this Stock
Don't leave your profits to chance. Historically, this stock follows specific seasonal patterns that institutional traders use to maximize returns.
- ✅ Identify the "Golden Buying Window"
- ✅ Avoid high-risk correction cycles
- ✅ Backtested data from the last 20+ years