June 04, 2026 a 09:31 am


U.S. Sectors - Performance Analysis
In the dynamic environment of the U.S. financial markets, sector performance over various time frames reveals pivotal trends and investor sentiment. Notably, Technology has exhibited robust growth, whereas more defensively oriented sectors appear to be struggling. This analysis dives deep into weekly, monthly, and quarterly sector performances to distill insights and potential implications for future market movements.
U.S. Sectors Performance One Week 📊
The one-week period highlights significant shifts in sector dynamics. Technology leads with a substantive gain of 4.96%, while cyclical sectors like Energy also demonstrate strength. Conversely, defensive sectors such as Healthcare and Consumer Staples face downward pressure. The striking underperformance of Communication underscores certain market hesitations.
| Sector | Performance (%) | Performance |
|---|---|---|
| Technology | 4.96 | |
| Energy | 3.07 | |
| Material | 0.53 | |
| Industrial | 0.15 | |
| Transportation | -0.48 | |
| Financial | -0.78 | |
| Utilities | -2.01 | |
| Real Estate | -2.03 | |
| Healthcare | -2.20 | |
| Consumer Staples | -2.70 | |
| Retail | -3.68 | |
| Communication | -3.98 |
U.S. Sectors Performance One Month 📊
Over the past month, Technology again outshines with a remarkable gain of 17.23%. Transportation also shows significant positive movement. Growth is tempered by declines in Utilities and Consumer Staples, reflecting a potential investor shift towards growth-oriented opportunities.
| Sector | Performance (%) | Performance |
|---|---|---|
| Technology | 17.23 | |
| Transportation | 6.04 | |
| Healthcare | 1.63 | |
| Industrial | 1.05 | |
| Material | 0.33 | |
| Energy | -0.95 | |
| Real Estate | -1.45 | |
| Financial | -1.35 | |
| Communication | -3.03 | |
| Consumer Staples | -2.21 | |
| Retail | -5.32 | |
| Utilities | -5.75 |
U.S. Sectors Performance Three Months 📊
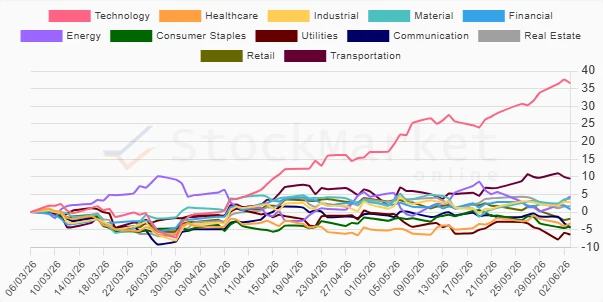
Quarterly results underscore the Technology sector's superior momentum with a striking 36.58% increase. Notably, Transportation and Material sectors also register strong performance. Defensive sectors, however, including Utilities, face significant pressure, potentially hinting at a reallocation toward higher-risk equities.
| Sector | Performance (%) | Performance |
|---|---|---|
| Technology | 36.58 | |
| Transportation | 9.50 | |
| Energy | 4.44 | |
| Material | 3.84 | |
| Industrial | 2.87 | |
| Real Estate | 1.67 | |
| Financial | 0.82 | |
| Retail | -1.91 | |
| Healthcare | -3.18 | |
| Communication | -4.40 | |
| Consumer Staples | -4.07 | |
| Utilities | -6.33 |
Summary 💡
Across the analyzed timeframes, Technology continues to dominate, substantiating its role as a growth leader. Meanwhile, sectors traditionally viewed as defensive lag far behind, illustrating shifting investor preferences towards cyclicality and growth. Investors should consider balancing exposure between high-growth and value segments, adjusting for potential macroeconomic changes.
Smart Data Insight
Master the Perfect Entry & Exit for this Stock
Don't leave your profits to chance. Historically, this stock follows specific seasonal patterns that institutional traders use to maximize returns.
- ✅ Identify the "Golden Buying Window"
- ✅ Avoid high-risk correction cycles
- ✅ Backtested data from the last 20+ years