
September 03, 2026 a 09:32 am


U.S. Sectors - Performance Analysis
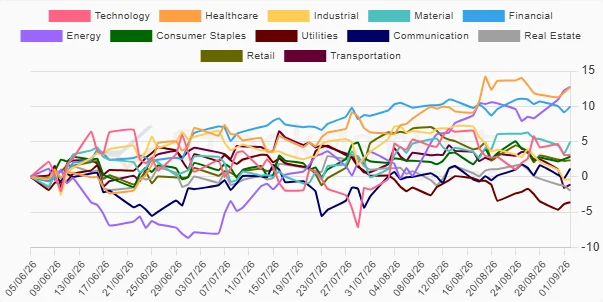
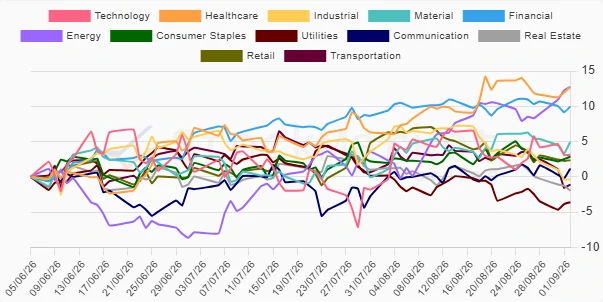
Understanding recent trends across U.S. sectors can offer significant insights into market dynamics and investor sentiment. This analysis aims to drill down into weekly, monthly, and quarterly performance data, spotlighting key performers and laggards. By examining the interaction between cyclical and defensive sectors, investors can better navigate the current economic landscape. 📊
U.S. Sectors Performance One Week
| Sector | Performance (%) | Performance |
|---|---|---|
| Energy | 4.45 | |
| Communication | 0.94 | |
| Healthcare | 0.81 | |
| Consumer Staples | 0.53 | |
| Retail | 0.30 | |
| Material | -0.50 | |
| Financial | -0.37 | |
| Utilities | -1.17 | |
| Real Estate | -2.09 | |
| Technology | -2.66 | |
| Industrial | -3.40 | |
| Transportation | -3.59 |
U.S. Sectors Performance One Month
| Sector | Performance (%) | Performance |
|---|---|---|
| Energy | 10.91 | |
| Healthcare | 6.64 | |
| Material | 1.92 | |
| Communication | 0.46 | |
| Consumer Staples | 0.25 | |
| Financial | -0.34 | |
| Real Estate | -3.17 | |
| Utilities | -3.23 | |
| Retail | -3.84 | |
| Transportation | -5.20 | |
| Technology | -1.61 | |
| Industrial | -7.50 |
U.S. Sectors Performance Three Months
| Sector | Performance (%) | Performance |
|---|---|---|
| Energy | 12.75 | |
| Healthcare | 12.69 | |
| Financial | 9.94 | |
| Material | 4.96 | |
| Technology | 3.09 | |
| Consumer Staples | 2.84 | |
| Retail | 2.35 | |
| Communication | 1.15 | |
| Industrial | -0.35 | |
| Transportation | -1.09 | |
| Real Estate | -1.95 | |
| Utilities | -3.61 |
Summary
Analyzing sector performances over various time frames reveals that Energy and Healthcare are consistently robust, particularly for the quarter where they posted double-digit gains. Conversely, Industrial and Transportation sectors have experienced continued weakness, particularly in the monthly and weekly analyses. Such trends emphasize the market's current favor toward defensive over cyclical sectors. This suggests a broader sentiment of risk aversion among investors reflecting potential macroeconomic concerns. Investors may consider adjusting their portfolios to leverage sectors with stable growth prospects while cautiously monitoring underperformers. 🔍
Smart Data Insight
Master the Perfect Entry & Exit for this Stock
Don't leave your profits to chance. Historically, this stock follows specific seasonal patterns that institutional traders use to maximize returns.
- ✅ Identify the "Golden Buying Window"
- ✅ Avoid high-risk correction cycles
- ✅ Backtested data from the last 20+ years