
July 02, 2026 a 09:32 am

U.S. Sectors - Performance Analysis
The recent performance of U.S. sectors reveals dynamic shifts, with certain sectors significantly outperforming others. Over shorter periods, Communication and Healthcare sectors showcased prominent gains, while Energy and Utilities faced notable declines. The analysis uncovers both defensive and cyclical trends that are shaping investment landscapes.
📊 U.S. Sectors Performance One Week
In the past week, the Communication sector led the performance chart with a substantial positive shift. Defensive sectors like Healthcare also saw significant gains, indicating a possible risk-averse sentiment among investors. Conversely, Energy and Utilities registered the largest declines, reflecting potential market concerns in these sectors.
| Sector | Performance (%) | Performance |
|---|---|---|
| Communication | 3.91% | |
| Healthcare | 2.54% | |
| Financial | 2.48% | |
| Transportation | 1.04% | |
| Retail | 0.96% | |
| Technology | 0.69% | |
| Consumer Staples | -0.74% | |
| Industrial | -0.39% | |
| Real Estate | -0.89% | |
| Utilities | -2.37% | |
| Energy | -2.38% | |
| Material | -1.57% |
📊 U.S. Sectors Performance One Month
Over the past month, Healthcare dominated the landscape with a robust gain, highlighting its current market resilience. Financial and Industrial sectors also showed notable upward trends, suggesting a positive outlook for these industries. However, Energy faced significant challenges, leading to the largest decline among sectors.
| Sector | Performance (%) | Performance |
|---|---|---|
| Healthcare | 8.76% | |
| Financial | 6.34% | |
| Industrial | 5.35% | |
| Transportation | 4.36% | |
| Utilities | 2.04% | |
| Consumer Staples | 1.91% | |
| Retail | 1.24% | |
| Real Estate | 1.70% | |
| Material | -0.78% | |
| Communication | -3.28% | |
| Technology | -5.79% | |
| Energy | -9.12% |
📊 U.S. Sectors Performance Three Months
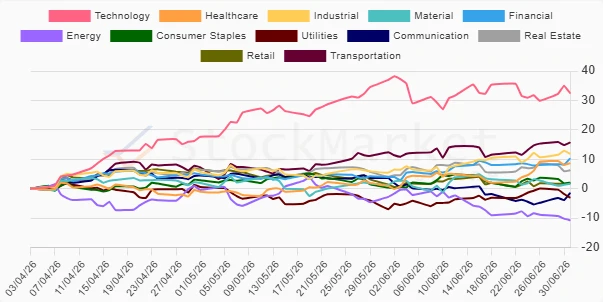
Over the last quarter, Technology surged remarkably, emphasizing a strong bullish sentiment in the tech industry. The Transportation sector also demonstrated impressive growth, while Energy continued to slump, underperforming across the board. This reflects a continued investor preference for growth and tech-oriented sectors over traditional energy-based investments.
| Sector | Performance (%) | Performance |
|---|---|---|
| Technology | 32.43% | |
| Transportation | 15.72% | |
| Industrial | 11.83% | |
| Financial | 10.30% | |
| Healthcare | 8.65% | |
| Real Estate | 6.25% | |
| Consumer Staples | 2.03% | |
| Retail | 1.77% | |
| Material | 1.65% | |
| Communication | -1.48% | |
| Utilities | -3.09% | |
| Energy | -10.79% |
✅ Summary
In conclusion, the analysis reveals a dynamic landscape with technology and certain defensive sectors dominating the gains, especially over the three-month period. Energy remains a consistent underperformer across all time frames. Investors seem to maintain a pronounced preference for growth sectors, particularly Technology, despite short-term fluctuations. Consequently, portfolios might benefit from a gradual shift towards these outperforming sectors, while cautiously evaluating the risk in traditionally underperforming segments.
Smart Data Insight
Master the Perfect Entry & Exit for this Stock
Don't leave your profits to chance. Historically, this stock follows specific seasonal patterns that institutional traders use to maximize returns.
- ✅ Identify the "Golden Buying Window"
- ✅ Avoid high-risk correction cycles
- ✅ Backtested data from the last 20+ years