March 25, 2026 a 04:03 am
SYY: Trend and Support & Resistance Analysis - Sysco Corporation
Sysco Corporation shares have demonstrated a mix of volatility and potential growth. Although the stock showcases resilience, the mix of recent economic factors and market sentiments have led to fluctuations in its value. Understanding the technical trends and key support and resistance levels is crucial for investors seeking strategic entry and exit points.
Trend Analysis
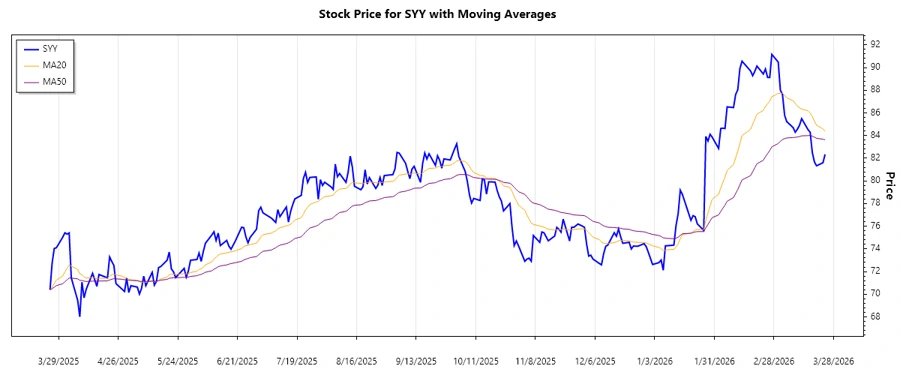
Based on the analysis of the Sysco Corporation (SYY) closing prices, it is apparent that the stock has been experiencing a downward trend. The EMA(20) and EMA(50) indicators provide additional insight into these trends over the studied period.
| Date | Closing Price | Trend |
|---|---|---|
| 24 Mar 2026 | 82.34 | ▼ Abwärtstrend |
| 23 Mar 2026 | 81.60 | ▼ Abwärtstrend |
| 20 Mar 2026 | 81.33 | ▼ Abwärtstrend |
| 19 Mar 2026 | 81.67 | ▼ Abwärtstrend |
| 18 Mar 2026 | 82.51 | ▲ Aufwärtstrend |
| 17 Mar 2026 | 84.29 | ▲ Aufwärtstrend |
| 16 Mar 2026 | 84.52 | ▲ Aufwärtstrend |
The current trend shows a downward movement in price which could signal potential risk if the trend continues without recovery. The EMAs indicate consolidation around critical points.
Support- and Resistance
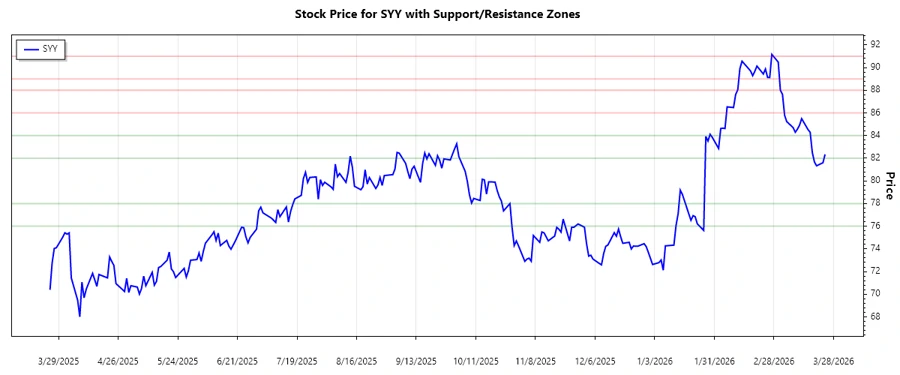
Through technical analysis, we identify two main support and resistance zones within recent trading activity. This analysis can provide investors with essential insight for technical trading strategies.
| Zone Type | From | To |
|---|---|---|
| Support Zone 1 | 76.00 | 78.00 |
| Support Zone 2 | 82.00 | 84.00 |
| Resistance Zone 1 | 86.00 | 88.00 |
| Resistance Zone 2 | 89.00 | 91.00 |
The current price range suggests that the stock is trading near its support zones, highlighting potential buying opportunities if these areas hold firm.
Conclusion
Despite recent market challenges, Sysco Corporation's stock finds itself at critical support levels which could invite buying interest. Investors should consider the potential for a bounce back or further declines. The clear resistance zones may pose hurdles if upward movement is initiated. Close monitoring of these zones will be crucial for short-term strategies.