December 12, 2025 a 09:03 am

SYY: Trend and Support & Resistance Analysis - Sysco Corporation
Sysco Corporation is a leading player in the foodservice distribution industry with a strong operational footprint across multiple countries. The recent price trends indicate a potential stabilization in its stock value, providing an interesting entry point for investors. While there are visible fluctuations, the firm's consistent performance might attract both short-term and long-term investors, depending on their risk appetite and market outlook.
Trend Analysis
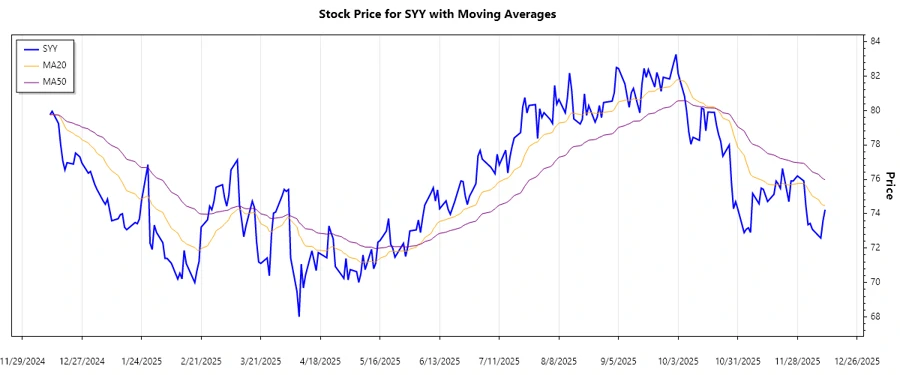
The analysis of Sysco Corporation's (SYY) stock over the past few months shows varying trends. Using the Exponential Moving Averages (EMAs), we can examine current trends more closely. The EMA20 line has recently crossed above the EMA50, indicating an upward trend. Here is a closer look at daily data for the past week:
| Date | Closing Price | Trend |
|---|---|---|
| 2025-12-11 | 74.23 | ▲ Upward |
| 2025-12-10 | 73.57 | ▲ Upward |
| 2025-12-09 | 72.59 | ▼ Downward |
| 2025-12-08 | 72.71 | ▲ Upward |
| 2025-12-05 | 73.10 | ▲ Upward |
| 2025-12-04 | 73.44 | ▲ Upward |
| 2025-12-03 | 73.36 | ⚖️ Stable |
In conclusion, recent technical signals suggest a positive sentiment, as the stock shows indications of entering an upward trajectory. However, investors must monitor for sustainability of this trend.
Support and Resistance
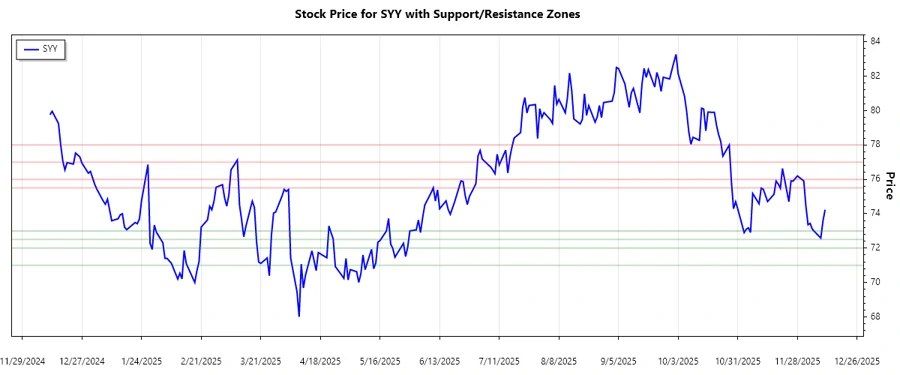
Based on the latest price data, several key support and resistance zones for Sysco Corporation have been identified. These are crucial levels that traders watch to make buy or sell decisions:
| Type | Zone From | Zone To |
|---|---|---|
| Support | 72.50 | 73.00 |
| Support | 71.00 | 72.00 |
| Resistance | 75.50 | 76.00 |
| Resistance | 77.00 | 78.00 |
Currently, the stock price hovers around the upper support zone, which may act as a launchpad for further upward movement. Conversely, failure to hold this level might lead to testing the lower support zones.
Conclusion
Sysco Corporation's stock currently exhibits positive momentum, concluding with a short-term bullish indication as the EMA20 has overtaken the EMA50. However, market uncertainties and supply chain factors can introduce volatility. While the identified support zones provide a cushion, traders should remain vigilant of resistance levels to gauge potential breakout opportunities. This signifies potential robust performance, though occasional pullbacks may offer more favorable entry points.