November 25, 2025 a 03:15 am

SYY: Trend and Support & Resistance Analysis - Sysco Corporation
The Sysco Corporation (SYY) has shown a complex movement pattern over recent months. Observing the trend analysis, we can determine a dominant pattern, supported by calculated exponential moving averages (EMA) over both short and medium terms. Additionally, we elaborate on significant support and resistance zones that influence investment decisions, providing a comprehensive technical outlook on SYY stock movements.
Trend Analysis
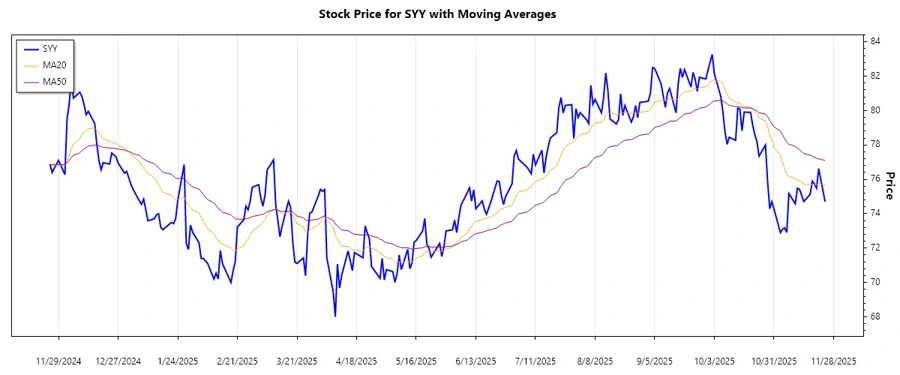
Recent activity in Sysco Corporation (SYY) stock prices reveals insights into the prevailing trend dynamics. By computing the 20-day EMA and the 50-day EMA, we assess the stock's trajectory and trend strength. Here's a concise representation of the data:
| Date | Closing Price | Trend |
|---|---|---|
| 2025-11-24 | $74.7 | ⚖️ |
| 2025-11-21 | $76.63 | ▼ |
| 2025-11-20 | $75.48 | ▼ |
| 2025-11-19 | $75.73 | ▼ |
| 2025-11-18 | $75.9 | ▼ |
| 2025-11-17 | $75.13 | ▼ |
| 2025-11-14 | $74.71 | ▼ |
By interpreting the trends and the EMA values, it's evident that the stock is in a downward momentum, with the EMA20 crossing below the EMA50, highlighting a bearish configuration in recent sessions.
Support- and Resistance
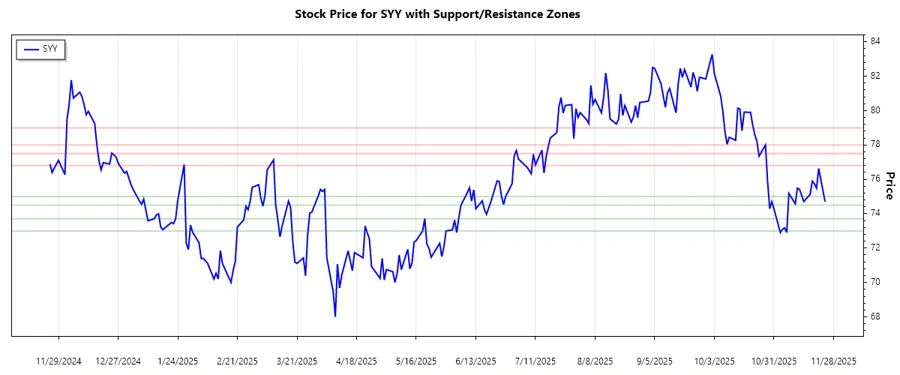
Sysco Corporation’s price action defines definitive areas of support and resistance, crucial for understanding price consolidations and potential breaks. Accordingly, we identify key zones:
| Zone Type | From | To |
|---|---|---|
| Support Zone 1 | $73.0 | $73.7 |
| Support Zone 2 | $74.5 | $75.0 |
| Resistance Zone 1 | $76.8 | $77.5 |
| Resistance Zone 2 | $78.0 | $79.0 |
The current closing price of $74.7 places it within the first support zone, indicating a potential for price stabilization or a bounce from these levels. This suggests careful monitoring is needed, as fluctuations around these zones will help determine the subsequent leg up or down.
Conclusion
Analyzing Sysco Corporation (SYY)'s recent market activity reveals a clear bearish momentum driven by the EMA crossover pattern. The market is at a critical juncture, testing established support levels. While these zones may present potential opportunities for value buying, the persistence of downward momentum signifies caution. Strategic considerations should account for volatility, yet hold potential upside should market sentiment pivot positively. The interplay of support and resistance zones could dictate the immediate trading horizon.
Smart Data Insight
Master the Perfect Entry & Exit for this Stock
Don't leave your profits to chance. Historically, this stock follows specific seasonal patterns that institutional traders use to maximize returns.
- ✅ Identify the "Golden Buying Window"
- ✅ Avoid high-risk correction cycles
- ✅ Backtested data from the last 20+ years