
July 27, 2026 a 06:44 am
SYY: Fibonacci Analysis - Sysco Corporation
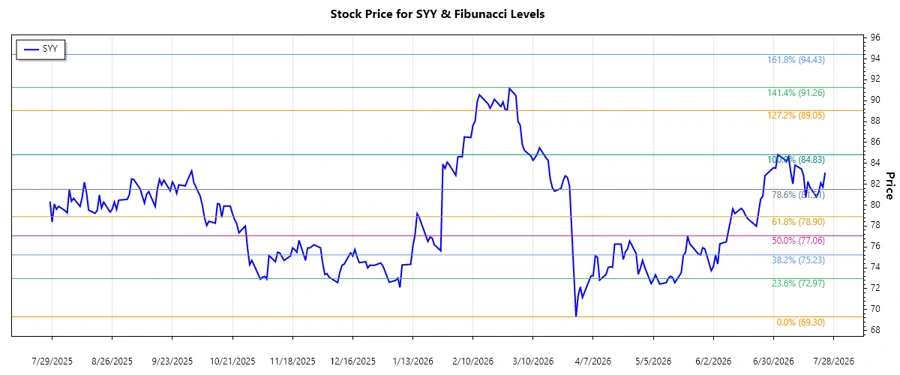
Sysco Corporation, operating globally in the foodservice industry, has shown a distinct uptrend over recent months. This trend indicates increasing investor confidence, potentially driven by strategic business expansions and operational efficiencies. With stability in consumer demand and improved supplier interactions, Sysco's stock performance remains robust. The analysis below suggests key technical levels to watch, based on Fibonacci retracement levels.
Fibonacci Analysis
| Attribute | Details |
|---|---|
| Trend Duration | 2026-03-30 to 2026-07-24 |
| High Point | $84.83 on 2026-07-02 |
| Low Point | $69.30 on 2026-03-30 |
| Fibonacci Levels |
|
| Current Price and Retracement | Current price is $83.11 and falls within the 0.786 retracement level. |
| Technical Interpretation | The current stock price being within the 0.786 retracement suggests potential resistance. A break above could signal continued bullish momentum. |
Conclusion
Sysco Corporation has effectively sustained an uptrend, primarily driven by its robust operational performance and strategic initiatives. Although the current price approaches a critical Fibonacci level indicating resistance, a successful breach could sustain upward momentum. Investors should cautiously watch for breakout signals while considering macroeconomic elements affecting the foodservice industry. Continued bullish indicators might render Sysco a viable candidate for portfolio inclusion, but potential downturns should be mitigated through strategic stop-loss measures.
Smart Data Insight
Master the Perfect Entry & Exit for this Stock
Don't leave your profits to chance. Historically, this stock follows specific seasonal patterns that institutional traders use to maximize returns.
- ✅ Identify the "Golden Buying Window"
- ✅ Avoid high-risk correction cycles
- ✅ Backtested data from the last 20+ years