
June 20, 2026 a 03:15 pm
SYY: Fibonacci Analysis - Sysco Corporation
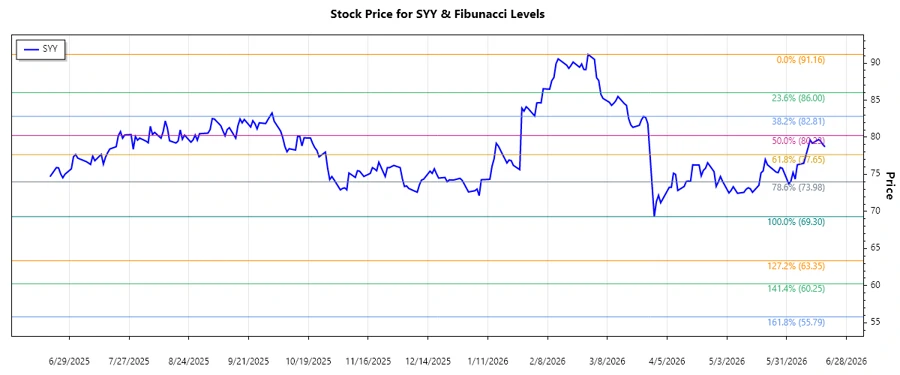
Sysco Corporation (SYY) has shown dynamic market movements in recent months. With its extensive global network and diverse range of products, Sysco continues to be a key player in the food distribution sector. The stock has experienced notable fluctuations, offering both opportunities and challenges for investors. Comprehensive technical analysis is crucial for navigating this volatile landscape.
Fibonacci Analysis
| Parameter | Value |
|---|---|
| Trend Period (Start - End) | 2026-03-02 to 2026-06-18 |
| High Price (Date) | $91.16 (2026-02-27) |
| Low Price (Date) | $69.3 (2026-03-30) |
| 0.236 Level | $75.88 |
| 0.382 Level | $79.44 |
| 0.5 Level | $82.23 |
| 0.618 Level | $85.02 |
| 0.786 Level | $89.19 |
| Retracement Zone | 0.382 |
| Interpretation | The current price is in the 0.382 retracement zone, suggesting a potential resistance level before further movements. |
Conclusion
The analysis of Sysco Corporation's recent stock movement highlights its position within a potential resistance zone at the 0.382 Fibonacci retracement level. While the retracement levels indicate possible support and resistance zones, market conditions and external factors continue to play a significant role. Traders should monitor price movements closely, paying attention to the defined levels for potential breakout or pullback signals. Investors are advised to remain prudent, balancing the optimism of Sysco's robust market presence with the uncertainties of its stock volatility.
Smart Data Insight
Master the Perfect Entry & Exit for this Stock
Don't leave your profits to chance. Historically, this stock follows specific seasonal patterns that institutional traders use to maximize returns.
- ✅ Identify the "Golden Buying Window"
- ✅ Avoid high-risk correction cycles
- ✅ Backtested data from the last 20+ years