August 29, 2025 a 04:45 pm
SYY: Fibonacci Analysis - Sysco Corporation
Sysco Corporation operates in a stable industry sector, providing food and related distribution services internationally. In recent months, its stock has shown resilience against broader market volatility. The technical analysis suggests that there has been a consistent uptrend, influenced perhaps by steady demand in the foodservice industry and expanding operations. This upward movement is a positive signal for investors looking for growth opportunities within blue-chip stocks.
Fibonacci Analysis
| Analysis Detail | Information |
|---|---|
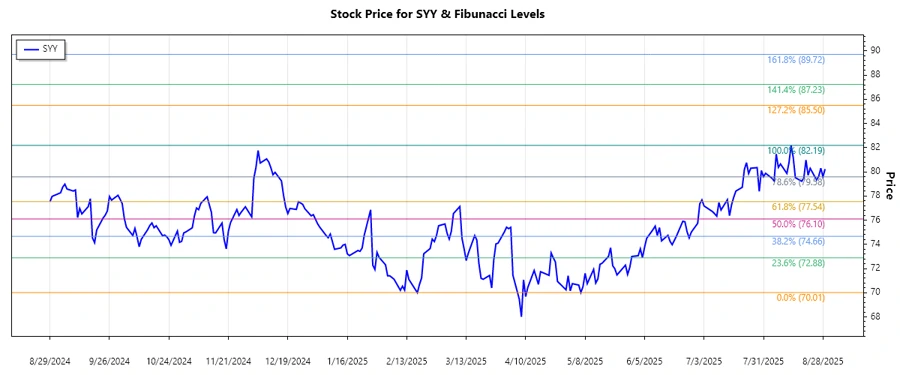
| Start Date | 2025-05-07 |
| End Date | 2025-08-29 |
| High Price (Date) | $82.19 (2025-08-13) |
| Low Price (Date) | $70.01 (2025-05-06) |
| Fibonacci Levels | |
| 0.236 | $73.03 |
| 0.382 | $75.36 |
| 0.5 | $76.10 |
| 0.618 | $78.83 |
| 0.786 | $81.01 |
| Current Price | $80.225 |
| Retracement Zone | 0.786 |
| Technical Interpretation | The current price is within the 0.786 retracement level, suggesting this might serve as a strong support zone. |
Conclusion
Sysco Corporation's recent stock performance illustrates a robust uptrend, likely bolstered by a dependable market demand and strategic business expansions. The positioning near the 0.786 Fibonacci retracement level can be interpreted as a technical support, offering investors a potential entry point with less downside risk. However, investors should remain cautious of market fluctuations and global supply chain dynamics that might impact performance. Overall, Sysco exhibits strong fundamentals that make it an enticing option for long-term growth enthusiasts and risk-averse investors alike.
Smart Data Insight
Master the Perfect Entry & Exit for this Stock
Don't leave your profits to chance. Historically, this stock follows specific seasonal patterns that institutional traders use to maximize returns.
- ✅ Identify the "Golden Buying Window"
- ✅ Avoid high-risk correction cycles
- ✅ Backtested data from the last 20+ years