May 04, 2026 a 03:31 am


SYY: Dividend Analysis - Sysco Corporation
Sysco Corporation presents itself as a solid choice for income-oriented investors, boasting a dividend yield of approximately 2.93%. With a strong dividend history of over 40 years, the company provides reliable returns. However, moderate growth rates and moderate payout ratios urge a cautious approach.
📊 Overview
Sysco operates within the food distribution industry, providing investors with a steady dividend yield and a remarkable history of consistent payments.
| Metric | Value |
|---|---|
| Sector | Food Distribution |
| Dividend yield | 2.93% |
| Current dividend per share | 2.05 USD |
| Dividend history | 40 years |
| Last cut or suspension | None |
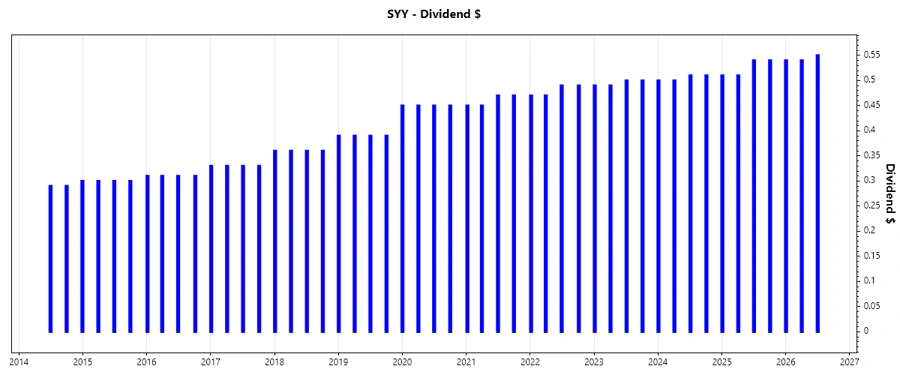
🗣️ Dividend History
This solid track record of dividend payments exemplifies Sysco's commitment to rewarding its shareholders. It is particularly crucial for assessing the reliability and longevity of income streams.
| Year | Dividend Per Share (USD) |
|---|---|
| 2026 | 1.63 |
| 2025 | 2.10 |
| 2024 | 2.02 |
| 2023 | 1.98 |
| 2022 | 1.92 |
📈 Dividend Growth
Monitoring dividend growth is essential to determine potential increases in income. Sysco's dividend growth rates highlight its ability to increment payouts sustainably.
| Time | Growth |
|---|---|
| 3 years | 3.03% |
| 5 years | 3.13% |
The average dividend growth is 3.13% over 5 years. This shows moderate but steady dividend growth.
✅ Payout Ratio
Payout ratios offer insight into the sustainability of dividend payments. A balance between earnings and free cash flow support solid paying capacity.
| Key figure ratio | Value |
|---|---|
| EPS-based | 56.57% |
| Free cash flow-based | 49.03% |
With a 56.57% payout ratio based on EPS and 49.03% on FCF, the dividends are comfortably supported by earnings and cash flow.
🗒️ Cashflow & Capital Efficiency
Sysco's cashflow metrics underline its operational efficiency and capacity for capital allocation, both critical for sustained dividend payouts.
| Metric | 2025 | 2024 | 2023 |
|---|---|---|---|
| Free Cash Flow Yield | 4.86% | 6.03% | 5.51% |
| Earnings Yield | 4.99% | 5.46% | 4.70% |
| CAPEX to Operating Cash Flow | 33.72% | 27.84% | 27.65% |
| Stock-based Compensation to Revenue | 0.11% | 0.13% | 0.13% |
| Free Cash Flow / Operating Cash Flow Ratio | 66.28% | 72.16% | 72.35% |
The indicators illustrate Sysco's effective capital utilization, ensuring a robust cashflow base for dividends.
📜 Balance Sheet & Leverage Analysis
Analyzing leverage ratios is vital for evaluating Sysco's financial resilience and its ability to withstand economic fluctuations.
| Metric | 2025 | 2024 | 2023 |
|---|---|---|---|
| Debt-to-Equity | 7.92 | 6.96 | 5.56 |
| Debt-to-Assets | 54.13% | 51.95% | 48.93% |
| Debt-to-Capital | 88.79% | 87.44% | 84.75% |
| Net Debt to EBITDA | 3.45 | 2.94 | 2.82 |
| Current Ratio | 1.21 | 1.20 | 1.24 |
| Quick Ratio | 0.70 | 0.69 | 0.72 |
| Financial Leverage | 14.63 | 13.40 | 11.36 |
Despite high leverage, Sysco maintains strong liquidity, aligning well with prudent financial management strategies.
📚 Fundamental Strength & Profitability
Profitability ratios provide insight into Sysco's capacity to generate profit relative to its revenue, costs, and capital.
| Metric | 2025 | 2024 | 2023 |
|---|---|---|---|
| Return on Equity | 99.89% | 105.11% | 88.10% |
| Return on Assets | 6.83% | 7.85% | 7.76% |
| Margins: Net | 2.25% | 2.48% | 2.32% |
| EBIT | 3.75% | 4.02% | 3.68% |
| EBITDA | 5.08% | 5.29% | 4.85% |
| Gross | 18.40% | 18.53% | 18.28% |
| Research & Development to Revenue | 0% | 0% | 0% |
Sysco's profitability remains robust, with strong returns on equity and a consistent margin profile, underscoring effective operational management.
📉 Price Development
📏 Dividend Scoring System
An analysis based on key dividend criteria assigns Sysco Corporation a commendable score for its dividend attributes.
| Criteria | Score | Indicator |
|---|---|---|
| Dividend yield | 4 | |
| Dividend Stability | 5 | |
| Dividend growth | 3 | |
| Payout ratio | 4 | |
| Financial stability | 3 | |
| Dividend continuity | 5 | |
| Cashflow Coverage | 4 | |
| Balance Sheet Quality | 3 |
Total Score: 31/40
⭐ Rating
Sysco Corporation is an attractive option for conservative investors seeking a stable dividend with a long track record. While its moderate growth rates are a consideration, its strong financials and continuity in dividend payments make it a worthy candidate for a dividend-focused portfolio.
Smart Data Insight
Master the Perfect Entry & Exit for this Stock
Don't leave your profits to chance. Historically, this stock follows specific seasonal patterns that institutional traders use to maximize returns.
- ✅ Identify the "Golden Buying Window"
- ✅ Avoid high-risk correction cycles
- ✅ Backtested data from the last 20+ years