February 24, 2026 a 03:31 pm

SYY: Dividend Analysis - Sysco Corporation
Sysco Corporation stands out as a reputable investment choice with a consistent dividend history spanning over four decades. The company's commitment to shareholder returns is underscored by its stable dividend yield, robust payout ratio, and moderate growth in dividend payments. With a solid financial environment, Sysco demonstrates significant potential for income-focused investors.
📊 Overview
Sysco Corporation operates within a stable sector, which supports its favorable dividend profile. This is highlighted by a consistent 2.93% dividend yield, reflecting the company's commitment to providing its shareholders with regular income. With 40 years of uninterrupted dividend history, investors can feel confident in the reliability of returns.
| Metric | Value |
|---|---|
| Sector | Consumer Goods |
| Dividend yield | 2.93% |
| Current dividend per share | 2.05 USD |
| Dividend history | 40 years |
| Last cut or suspension | None |
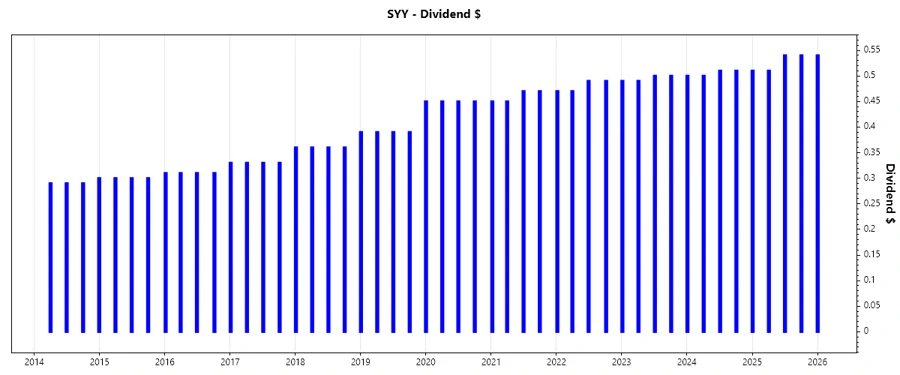
📈 Dividend History
The historical stability and growth of Sysco's dividends underscore the company's resilient financial health and its priority in shareholder returns. Prominent as a factor of investment assurance, this reflects Sysco's strong cash flow generation and strategic capital allocation.

| Year | Dividend per Share (USD) |
|---|---|
| 2026 | 0.54 |
| 2025 | 2.10 |
| 2024 | 2.02 |
| 2023 | 1.98 |
| 2022 | 1.92 |
📉 Dividend Growth
Dividend growth is a pivotal metric that reveals how a company's earnings potential and its strategic initiatives translate into shareholder rewards. Sysco's moderate yet steady growth over the past years indicates a commitment to enhancing shareholder value.
| Timeframe | Growth |
|---|---|
| 3 years | 3.03% |
| 5 years | 3.13% |
The average dividend growth is 3.13% over 5 years. This shows moderate but steady dividend growth.
🗣️ Payout Ratio
The payout ratio is a critical indicator of the sustainability of dividend payments. A balanced ratio signifies a healthy alignment between earnings retention and shareholder distribution, ensuring long-term payout viability.
| Key Figure | Ratio |
|---|---|
| EPS-based | 54.65% |
| Free Cash Flow-based | 50.91% |
The EPS-based payout of 54.65% and FCF-based payout of 50.91% reflect a prudent distribution strategy, indicating room for further dividend growth while retaining profitability.
💰 Cashflow & Capital Efficiency
A thorough analysis of cash flow and capital efficiency helps assess the company's financial flexibility and its ability to support dividends. These metrics provide insights into investment efficiency and operational prowess.
| Year | 2023 | 2024 | 2025 |
|---|---|---|---|
| Free Cash Flow Yield | 5.51% | 6.03% | 4.86% |
| Earnings Yield | 4.70% | 5.46% | 4.99% |
| CAPEX to Operating Cash Flow | 27.65% | 27.84% | 33.72% |
| Stock-based Compensation to Revenue | 0.13% | 0.13% | 0.11% |
| Free Cash Flow / Operating Cash Flow Ratio | 72.35% | 72.16% | 66.28% |
Sysco's cash flow stability is underpinned by its consistent free cash flow yield and prudent capital expenditure, supporting continued growth and shareholder distributions.
📈 Balance Sheet & Leverage Analysis
Analyzing leverage ratios provides a perspective on Sysco's financial stability, liquidity, and the efficacious management of its debt load, crucial for maintaining fiscal health and sustaining dividends.
| Year | 2023 | 2024 | 2025 |
|---|---|---|---|
| Debt-to-Equity | 5.56 | 6.96 | 7.92 |
| Debt-to-Assets | 48.93% | 51.95% | 54.13% |
| Debt-to-Capital | 84.75% | 87.44% | 88.79% |
| Net Debt to EBITDA | 2.82 | 2.94 | 3.25 |
| Current Ratio | 1.24 | 1.20 | 1.30 |
| Quick Ratio | 0.72 | 0.69 | 0.70 |
| Financial Leverage | 11.36 | 13.40 | 14.63 |
The financial leverage and debt metrics indicate a substantial debt load, yet the company's stable cash flows advocate for its ability to manage liabilities while maintaining a prudent risk profile.
✅ Fundamental Strength & Profitability
Evaluating core profitability ratios, including returns and margins, showcases Sysco's efficiency in capital management and its capability to sustain competitive operations, which are vital for ongoing financial performance and dividends.
| Year | 2023 | 2024 | 2025 |
|---|---|---|---|
| Return on Equity | 88.10% | 105.11% | 99.89% |
| Return on Assets | 7.76% | 7.85% | 6.83% |
| Margins: Net | 2.32% | 2.48% | 2.25% |
| Margins: EBIT | 3.68% | 4.02% | 3.75% |
| Margins: EBITDA | 4.85% | 5.29% | 5.08% |
| Margins: Gross | 18.28% | 18.53% | 18.40% |
| Research & Development to Revenue | 0% | 0% | 0% |
Sysco's robust return ratios and margins indicate effective cost management and profitability, affirming its capacity for continuous dividend distributions and strategic growth.
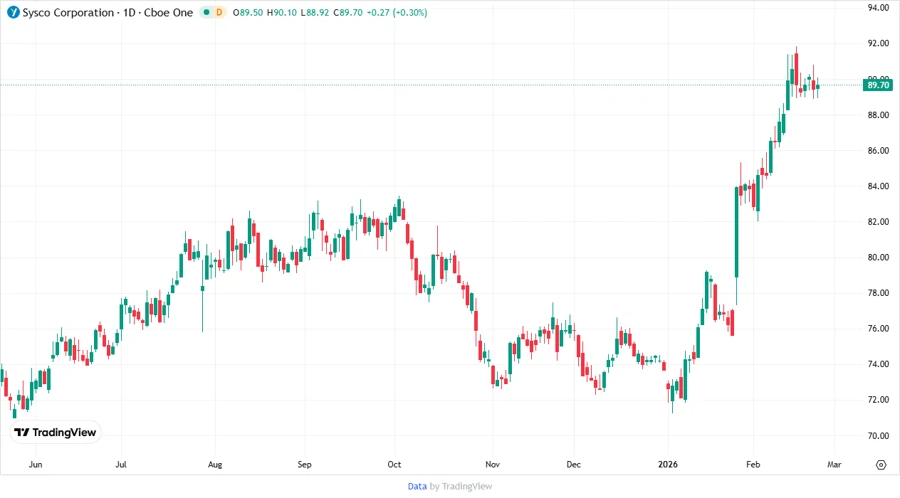
🗓 Price Development
📊 Dividend Scoring System
| Category | Description | Score |
|---|---|---|
| Dividend yield | Consistent and attractive yield for investors. | 4 |
| Dividend Stability | Strong historical consistency and reliability. | 5 |
| Dividend growth | Moderate growth over the years. | 3 |
| Payout ratio | Well-balanced with room for growth. | 4 |
| Financial stability | Maintains strong leverage and cash flow metrics. | 3 |
| Dividend continuity | Significant track record without suspension. | 5 |
| Cashflow Coverage | Adequate coverage for sustainable dividends. | 4 |
| Balance Sheet Quality | Relatively high leverage but manageable. | 3 |
Total Score: 31/40
🗣️ Rating
Sysco Corporation presents a compelling dividend investment opportunity, characterized by consistent returns, a robust history of distributions, and moderate growth prospects. While leverage levels warrant monitoring, the company's solid cash flow generation and operational efficiency augur well for its ability to sustain and potentially enhance dividends in the long run. This makes Sysco a suitable choice for income-seeking investors.