October 27, 2025 a 12:47 pm

SYY: Dividend Analysis - Sysco Corporation
Sysco Corporation presents a compelling dividend profile characterized by a solid dividend yield of about 2.56% and a history of dividend payments spanning 39 years. Despite a cut or suspension in 2015, the company maintains a commendable record of increasing dividends, suggesting resilience and an ongoing commitment to returning value to shareholders.
📊 Overview
Sysco operates within the Consumer Goods sector, recognized for its consistent dividend payments and sustainable growth. The company's dividend yield and stable history indicate a matured but robust financial standing.
| Metric | Value |
|---|---|
| Sector | Consumer Goods |
| Dividend yield | 2.56% |
| Current dividend per share | 2.05 USD |
| Dividend history | 39 years |
| Last cut or suspension | 2015 |
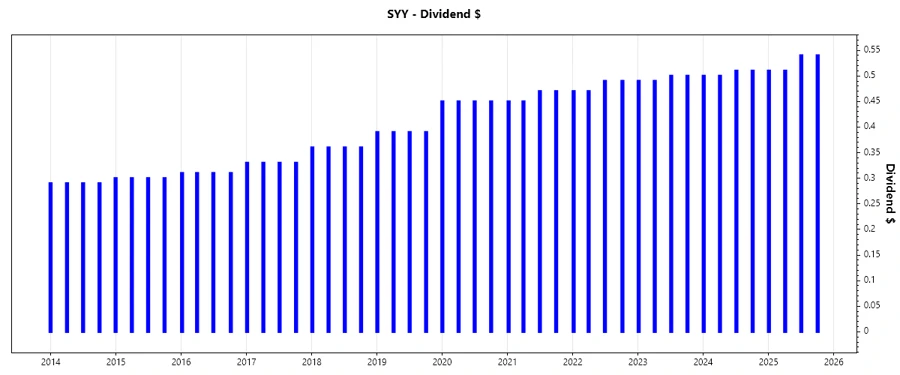
🗣️ Dividend History
The dividend history underscores Sysco's long-standing commitment to its shareholders. Maintaining or increasing dividend payments over decades exhibits financial strength and stability, vital for building investor confidence.
| Year | Dividend per Share (USD) |
|---|---|
| 2025 | 2.10 |
| 2024 | 2.02 |
| 2023 | 1.98 |
| 2022 | 1.92 |
| 2021 | 1.84 |
📈 Dividend Growth
Dividend growth is a critical metric, reflecting the company's ability to increase shareholder payouts over time. Sysco's dividend growth rates over three and five years show moderated but sustainable expansion, indicating a positive outlook for future dividend increases.
| Time | Growth |
|---|---|
| 3 years | 3.16% |
| 5 years | 5.30% |
The average dividend growth is 5.30% over 5 years. This shows moderate but steady dividend growth.
🏦 Payout Ratio
The payout ratio indicates the proportion of earnings used to pay dividends and is crucial in assessing sustainability. With an EPS-based payout ratio of 54.05% and an FCF-based ratio of 56.15%, Sysco maintains a healthy balance, supporting continued dividend distributions.
| Key figure | Ratio |
|---|---|
| EPS-based | 54.05% |
| Free cash flow-based | 56.15% |
Sysco's EPS and FCF payout ratios showcase disciplined financial management, with balanced proportions supporting durable dividends.
💡 Cashflow & Capital Efficiency
Evaluating cash flow and capital efficiency ratios reveals Sysco's prowess in managing its operational and investment finances effectively. This ensures stable cash returns and prudent capital allocations.
| Metric | 2023 | 2024 | 2025 |
|---|---|---|---|
| Free Cash Flow Yield | 4.74% | 6.03% | 4.86% |
| Earnings Yield | 4.92% | 5.46% | 4.99% |
| CAPEX to Operating Cash Flow | 33.72% | 27.84% | 33.72% |
| Stock-based Compensation to Revenue | 0.11% | 0.13% | 0.11% |
| Free Cash Flow / Operating Cash Flow Ratio | 66.28% | 72.16% | 66.28% |
The cash flow and capital structure emphasize a resilient financial foundation, providing confidence in Sysco's ongoing capital efficiency efforts and returns on investment.
💳 Balance Sheet & Leverage Analysis
Sysco's balance sheet strength is vital to gauge its financial stability, debt management, and liquidity position, ensuring long-term solvency and operational resilience.
| Metric | 2023 | 2024 | 2025 |
|---|---|---|---|
| Debt-to-Equity | 5.56 | 6.96 | 7.92 |
| Debt-to-Assets | 48.93% | 51.95% | 54.13% |
| Debt-to-Capital | 84.75% | 87.44% | 88.79% |
| Net Debt to EBITDA | 2.82 | 2.94 | 3.30 |
| Current Ratio | 1.24 | 1.20 | 1.21 |
| Quick Ratio | 0.72 | 0.69 | 0.70 |
| Financial Leverage | 11.36 | 13.40 | 14.63 |
The leverage analysis suggests moderate debt levels, with a well-managed asset-backed balance sheet providing comfort in Sysco's financial health and flexibility.
📊 Fundamental Strength & Profitability
Understanding foundational profitability and efficient use of assets are key indicators of Sysco's operational success and sustainable growth potential.
| Metric | 2023 | 2024 | 2025 |
|---|---|---|---|
| Return on Equity | 88.10% | 105.11% | 99.89% |
| Return on Assets | 7.76% | 7.85% | 6.83% |
| Margins: Net | 2.32% | 2.48% | 2.25% |
| Margins: EBIT | 3.68% | 4.02% | 3.75% |
| Margins: EBITDA | 4.85% | 5.29% | 5.08% |
| Margins: Gross | 18.28% | 18.53% | 18.40% |
| R&D to Revenue | 0% | 0% | 0% |
Indicators of operational efficiency are solid, reflecting Sysco's adeptness in leveraging equity and assets to maximize returns and margins, sustaining its profitability.
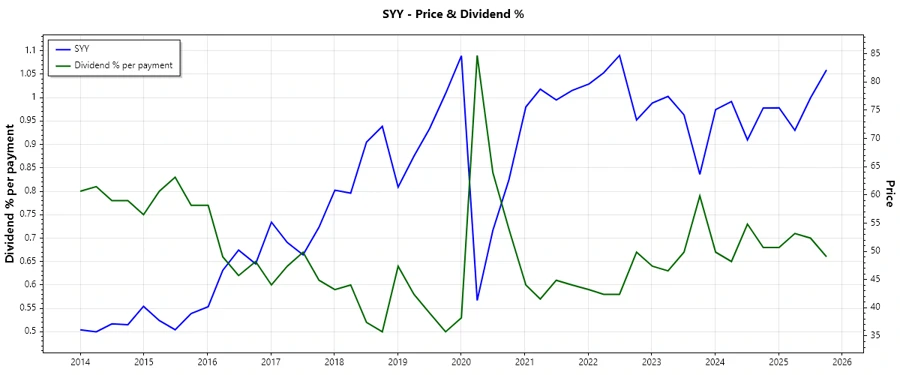
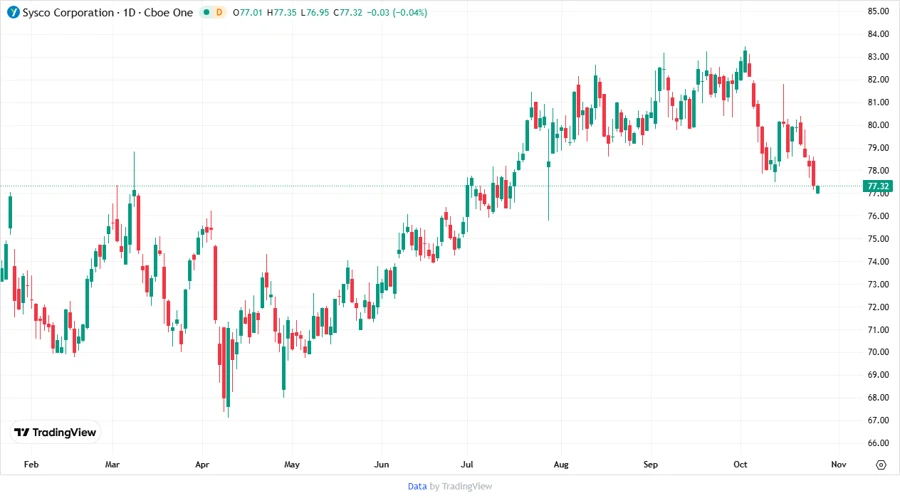
📉 Price Development
✅ Dividend Scoring System
The dividend scoring system provides a structured view to assess Sysco's dividend distribution proficiency across multiple performance indicators, each rated out of 5.
| Criterion | Score | |
|---|---|---|
| Dividend yield | 4 | |
| Dividend Stability | 5 | |
| Dividend growth | 3 | |
| Payout ratio | 4 | |
| Financial stability | 4 | |
| Dividend continuity | 5 | |
| Cashflow Coverage | 4 | |
| Balance Sheet Quality | 3 |
Total Score: 32/40
🔔 Rating
Sysco Corporation exhibits a compelling dividend profile with consistent and moderated growth potential. The financial strength and dividend strategies position Sysco as a reliable income-generating investment in the Consumer Goods sector.
Smart Data Insight
Master the Perfect Entry & Exit for this Stock
Don't leave your profits to chance. Historically, this stock follows specific seasonal patterns that institutional traders use to maximize returns.
- ✅ Identify the "Golden Buying Window"
- ✅ Avoid high-risk correction cycles
- ✅ Backtested data from the last 20+ years