September 28, 2025 a 12:47 pm

SYY: Dividend Analysis - Sysco Corporation
Sysco Corporation offers a robust dividend profile, coupled with consistent dividend growth and solid financial stability. While its payout ratios are slightly high, the ongoing commitment to shareholder returns is evident through its extensive dividend history. Investors may find the moderate yet steady dividend growth an appealing aspect, particularly for those seeking stable income streams from investments.
📊 Overview
The overview of Sysco Corporation presents a compelling dividend profile within the distribution sector. This segment alone underscores a sustainable dividend yield of 2.56% coupled with a current dividend per share at $2.05. The company showcases an impressive 39-year dividend history without recent cuts, indicating robust dividend consistency and shareholder rewards.
| Metric | Value |
|---|---|
| Sector | Distribution |
| Dividend Yield | 2.56% |
| Current Dividend Per Share | 2.05 USD |
| Dividend History | 39 years |
| Last Cut or Suspension | 2015 |
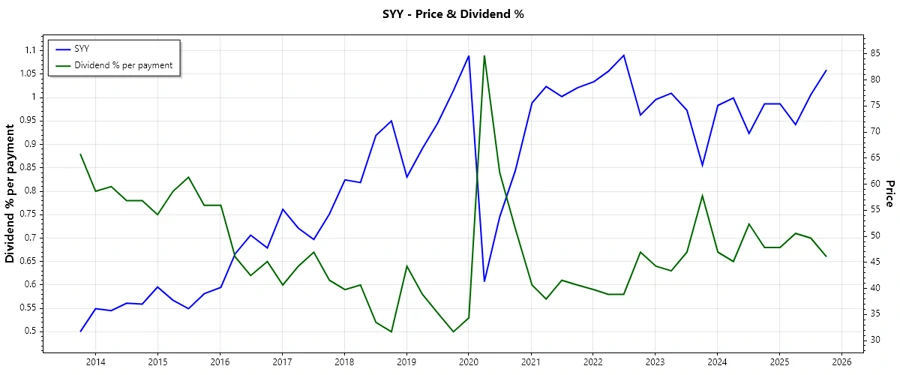
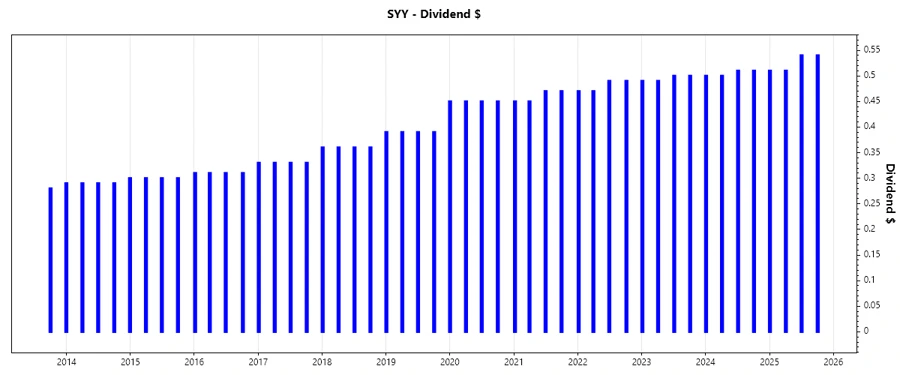
📈 Dividend History
The longevity and perseverance of Sysco Corporation's dividend issuances sharply highlight its intrinsic value to investors. A consistent payment track over decades fortifies investor confidence, making it a stable choice in the dividend landscape. Its resilience through financial turmoils showcases commitment to maintaining shareholder value.
| Year | Dividend Per Share (USD) |
|---|---|
| 2025 | 2.10 |
| 2024 | 2.02 |
| 2023 | 1.98 |
| 2022 | 1.92 |
| 2021 | 1.84 |
📈 Dividend Growth
Examining Sysco's dividend growth trajectory reveals a 3.16% growth over 3 years and a 5.30% growth over the last 5-year period. These figures indicate a consistent increase in shareholder payouts, suggesting confidence in sustained operational performance and capital management.
| Time | Growth |
|---|---|
| 3 years | 3.16% |
| 5 years | 5.30% |
The average dividend growth is 5.30% over 5 years. This shows moderate but steady dividend growth and reflects positively on Sysco's strategic fiscal planning, appealing to long-term dividend growth investors.
📉 Payout Ratio
Payout ratios are critical in understanding the sustainability of dividend payments. Sysco Corporation's EPS-based payout ratio stands at 54.05%, while the FCF-based payout is slightly higher at 56.15%. Maintaining payout ratios below 60% is generally perceived as healthy, indicating the dividends are sustainable within the company's earning capacity.
| Key figure | Ratio |
|---|---|
| EPS-based | 54.05% |
| Free Cash Flow-based | 56.15% |
Both ratios being under 60% reflect prudent financial management ensuring dividends are well-covered by earnings, suggesting sustainability and potential room for future growth even amid market fluctuations.
🗣️ Cashflow & Capital Efficiency
A thorough analysis of cash flow and capital efficiency highlights essentials for dividend sustainability. The following metrics provide insights into operational cash flow efficiencies and capital usage:
| Metric | 2023 | 2024 | 2025 |
|---|---|---|---|
| Free Cash Flow Yield | 5.51% | 6.03% | 4.86% |
| Earnings Yield | 4.70% | 5.46% | 4.99% |
| CAPEX to Operating Cash Flow | 27.65% | 27.84% | 33.72% |
| Stock-based Compensation to Revenue | 0.13% | 0.13% | 0.11% |
| Free Cash Flow / Operating Cash Flow Ratio | 72.35% | 72.16% | 66.28% |
| Return on Invested Capital | 16.30% | 15.00% | 13.03% |
Sysco's ability to maintain a high free cash flow yield and a stable CAPEX ratio around 30% illustrates robust cash-generating proficiency and disciplined capital spending, boosting investor confidence in dividend sustainability.
🗣️ Balance Sheet & Leverage Analysis
The leverage and balance sheet metrics are pivotal in assessing Sysco Corporation's financial stability and risk. Debt metrics and liquidity ratios provide essential insights into the firm's debt management and short-term financial health.
| Metric | 2023 | 2024 | 2025 |
|---|---|---|---|
| Debt-to-Equity | 5.56 | 6.96 | 7.92 |
| Debt-to-Assets | 0.49 | 0.52 | 0.54 |
| Debt-to-Capital | 0.85 | 0.87 | 0.89 |
| Net Debt to EBITDA | 2.82 | 2.94 | 3.30 |
| Current Ratio | 1.24 | 1.20 | 1.21 |
| Quick Ratio | 0.72 | 0.69 | 0.70 |
| Financial Leverage | 11.36 | 13.40 | 14.63 |
While leverage ratios are on the higher end, liquidity ratios indicate potential short-term financial strain. The company's significant debt exposure necessitates careful monitoring but is somewhat alleviated by consistent EBITDA generation and interest coverage.
🗣️ Fundamental Strength & Profitability
Fundamental strength and profitability margins provide insight into Sysco Corporation's operational effectiveness and profitability potential. Strong returns on equity and assets further enhance growth potential.
| Metric | 2023 | 2024 | 2025 |
|---|---|---|---|
| Return on Equity | 88.10% | 105.11% | 99.89% |
| Return on Assets | 7.76% | 7.85% | 6.83% |
| Net Margin | 2.32% | 2.48% | 2.25% |
| EBIT Margin | 3.68% | 4.02% | 3.75% |
| EBITDA Margin | 4.85% | 5.29% | 5.08% |
| Gross Margin | 18.28% | 18.53% | 18.40% |
| R&D to Revenue | 0.00% | 0.00% | 0.00% |
Strong fundamental health suggested by ROE combined with operational efficiency margins portray a robust profitability profile, allowing continued investment in growth-driving initiatives and enhancing dividend confidence.
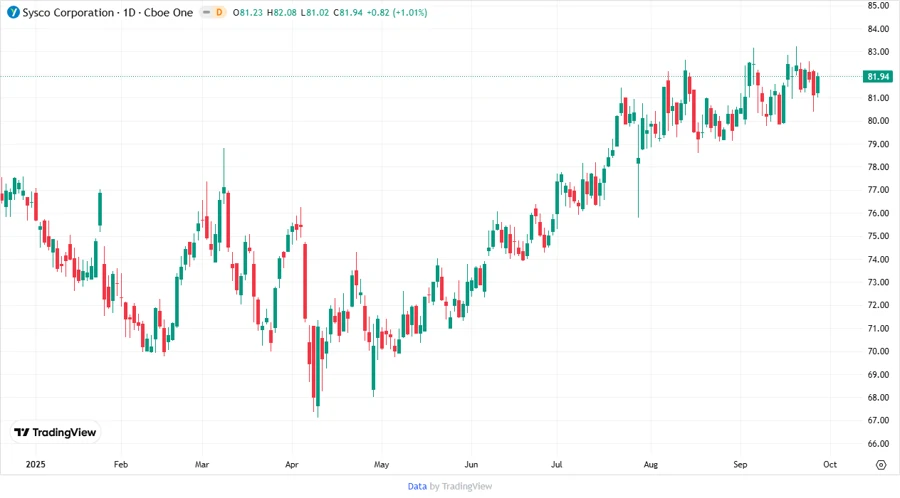
📈 Price Development
📊 Dividend Scoring System
Sysco Corporation's dividend profile evaluation through a scoring system provides structured insights, enabling strategic investment decisions:
| Criteria | Score | |
|---|---|---|
| Dividend Yield | 4 | |
| Dividend Stability | 5 | |
| Dividend Growth | 3 | |
| Payout Ratio | 4 | |
| Financial Stability | 3 | |
| Dividend Continuity | 5 | |
| Cashflow Coverage | 4 | |
| Balance Sheet Quality | 3 |
Total Score: 31/40
✅ Rating
Sysco Corporation scores favorably as a reliable dividend option, with strong historical stability and consistent growth indicators. The investment risk is moderately mitigated by strong operational cash flow and profitability metrics, making it a suitable proposition for income-seeking portfolios. Cautious monitoring of leverage is advised to ensure continued financial health and dividend preservation.
Smart Data Insight
Master the Perfect Entry & Exit for this Stock
Don't leave your profits to chance. Historically, this stock follows specific seasonal patterns that institutional traders use to maximize returns.
- ✅ Identify the "Golden Buying Window"
- ✅ Avoid high-risk correction cycles
- ✅ Backtested data from the last 20+ years