
June 22, 2026 a 01:15 pm

SYK: Trend and Support & Resistance Analysis - Stryker Corporation
Stryker Corporation operates in the medical technology sector, known for its extensive product lines in Orthopaedics, Spine, MedSurg, and Neurotechnology. The stock of Stryker has shown resilience in the past few months, with a tendency to demonstrate steady growth. Investors closely monitor the technical indicators, such as moving averages, to make informed decisions. Analyzing the closing prices and derived indicators provides a deeper insight into potential future performance.
Trend Analysis
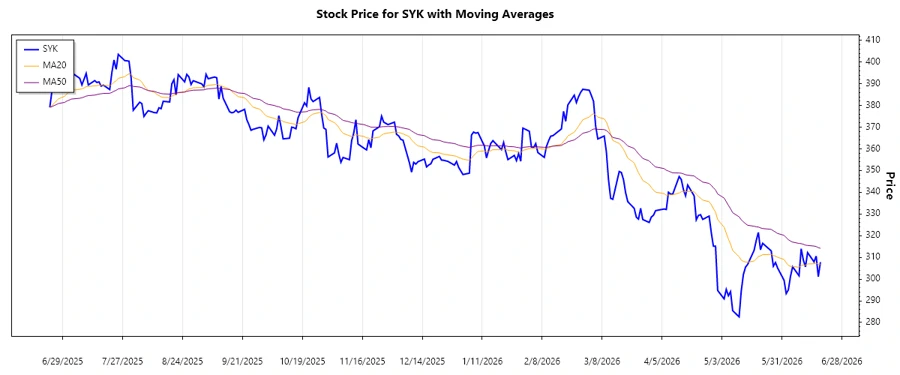
The Stryker Corporation stock has exhibited a particular trend based on its recent closing prices. Analyzing the Exponential Moving Averages (EMA), we find:
| Date | Close Price | Trend |
|---|---|---|
| 2026-06-18 | 307.80 | ▼ Downtrend |
| 2026-06-17 | 301.14 | ▼ Downtrend |
| 2026-06-16 | 310.58 | ▼ Downtrend |
| 2026-06-15 | 307.94 | ▼ Downtrend |
| 2026-06-12 | 312.20 | ▼ Downtrend |
| 2026-06-11 | 305.64 | ▼ Downtrend |
| 2026-06-10 | 308.84 | ▼ Downtrend |
The EMA20 is below EMA50, indicating a sustained downtrend over the past weeks. Thus, it signals a bearish sentiment in the market for Stryker.
Support- and Resistance
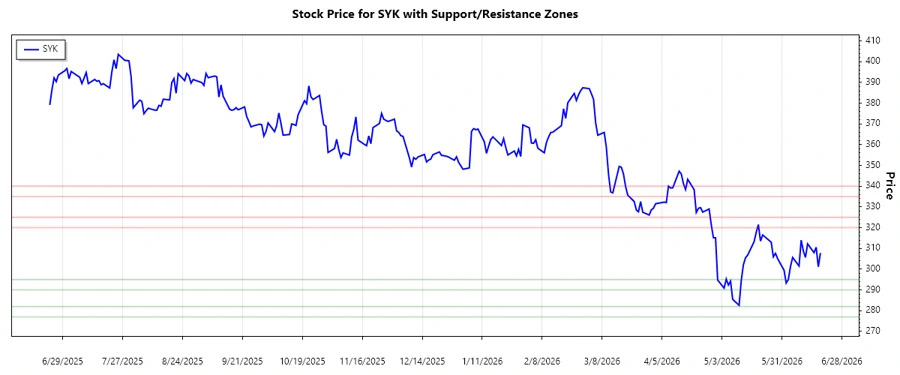
Identifying support and resistance levels is crucial for predicting potential price movements. Based on recent data, the following zones have been noticeable:
| Zone | Range | Type |
|---|---|---|
| Support 1 | 290.00 - 295.00 | ▲ Support |
| Support 2 | 277.00 - 282.00 | ▲ Support |
| Resistance 1 | 320.00 - 325.00 | ▼ Resistance |
| Resistance 2 | 335.00 - 340.00 | ▼ Resistance |
The current price sits closer to the second support zone, suggesting potential stabilization, which could delay further declines.
Conclusion
The analysis of Stryker Corporation's stock indicates a downtrend characterized by a bearish market sentiment. The support zones provide potential points where buying interest could emerge, potentially slowing the decline. The resistance zones highlight regions where upward movements may face pressure. Investors should consider these technical levels when making trading decisions, focusing on any breakouts or reversals around these zones. Aligning with the overall market sentiment and upcoming economic indicators could further elucidate future price actions for Stryker's stock.
Smart Data Insight
Master the Perfect Entry & Exit for this Stock
Don't leave your profits to chance. Historically, this stock follows specific seasonal patterns that institutional traders use to maximize returns.
- ✅ Identify the "Golden Buying Window"
- ✅ Avoid high-risk correction cycles
- ✅ Backtested data from the last 20+ years