
July 15, 2026 a 11:43 am

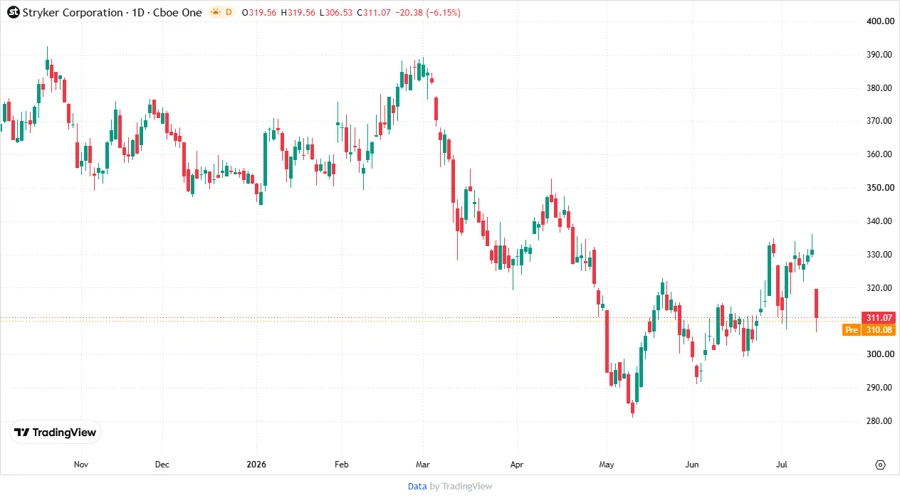
SYK: Fundamental Ratio Analysis - Stryker Corporation
The Stryker Corporation stock represents a strong player in the medical technology sector, showcasing promising growth opportunities. Despite some valuation challenges, its strategic positioning in orthopaedics and neurotechnology continues to drive robust revenue streams across 75 countries.
Fundamental Rating
Stryker's fundamental rating illustrates a moderately positive outlook, with strength in cash flow analysis and equity returns, offset by weaker debt and valuation metrics.
| Category | Score | Score Visual |
|---|---|---|
| Discounted Cash Flow | 4 | |
| Return on Equity | 4 | |
| Return on Assets | 4 | |
| Debt to Equity | 1 | |
| Price to Earnings | 1 | |
| Price to Book | 2 |
Historical Rating
The historical rating shows a consistent performance with recent improvements in scores.
| Date | Overall | DCF | ROE | ROA | D/E | P/E | P/B |
|---|---|---|---|---|---|---|---|
| 2026-07-14 | 3 | 4 | 4 | 4 | 1 | 1 | 2 |
| Previous Date | 0 | 4 | 4 | 4 | 1 | 1 | 2 |
Analyst Price Targets
Analysts suggest a solid growth potential with a favorable consensus on pricing targets.
| High | Low | Median | Consensus |
|---|---|---|---|
| $465 | $315 | $378 | $381.79 |
Analyst Sentiments
Analyst sentiment highlights a predominantly buy-oriented perspective.
| Recommendation | Count | Distribution |
|---|---|---|
| Strong Buy | 1 | |
| Buy | 37 | |
| Hold | 13 | |
| Sell | 0 | |
| Strong Sell | 0 |
Conclusion
Stryker Corporation maintains a robust stance within the medical technology realm, combining innovation with strategic expansion. While facing some financial ratio challenges, its vast international distribution network and diversified product offerings mitigate risks, promising sustained growth. Stakeholders should consider its balanced analyst endorsements and competitive positioning in future investment decisions.
Smart Data Insight
Master the Perfect Entry & Exit for this Stock
Don't leave your profits to chance. Historically, this stock follows specific seasonal patterns that institutional traders use to maximize returns.
- ✅ Identify the "Golden Buying Window"
- ✅ Avoid high-risk correction cycles
- ✅ Backtested data from the last 20+ years