November 21, 2025 a 10:15 am
SYK: Fibunacci Analysis - Stryker Corporation
The Stryker Corporation stock, trading under the ticker SYK, remains a substantial force in the medical technology sector. With a well-diversified portfolio across MedSurg, Neurotechnology, and Orthopaedics, the company continues to drive innovation and expand its global presence. Despite competitive pressures, Stryker's strategic focus on cutting-edge solutions places it in a favorable position for long-term growth.
Fibonacci Analysis
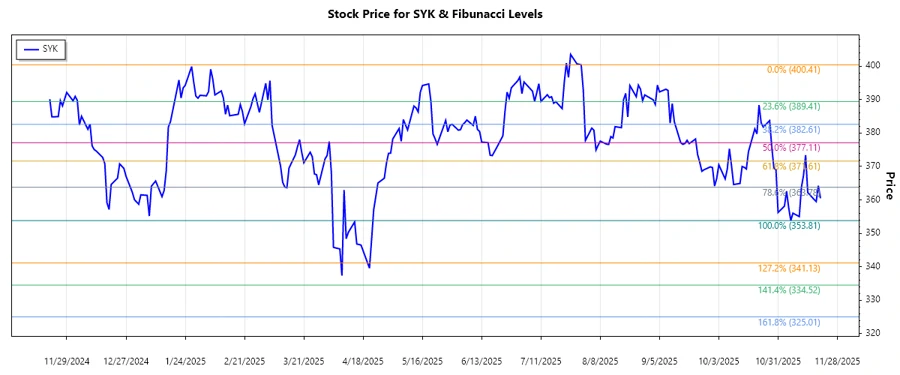
After analyzing the historical data of Stryker Corporation's stock, a dominant downward trend was identified. This analysis covers the period from 2025-07-30 to 2025-11-20. The stock saw a high of $400.41 on 2025-07-30 and reached a low of $353.81 on 2025-11-06.
| Trend Start Date | Trend End Date | High Price (Date) | Low Price (Date) |
|---|---|---|---|
| 2025-07-30 | 2025-11-20 | $400.41 (2025-07-30) | $353.81 (2025-11-06) |
| Fibonacci Level | Price |
|---|---|
| 0.236 | $388.46 |
| 0.382 | $382.87 |
| 0.5 | $377.11 |
| 0.618 | $371.36 |
| 0.786 | $362.34 |
The current price of $360.48 on 2025-11-20 suggests that the stock is in the 0.786 Fibonacci retracement area. This level often signifies strong support and could potentially indicate a reversal.
Conclusion
In summary, Stryker Corporation's recent downtrend reflects broader market adjustments but highlights potential buying opportunities as it nears pivotal retracement levels. Analysts should consider the robust fundamentals of Stryker and its resilience in sustaining competitive advantages despite short-term volatility. Investors might find value in monitoring price stability near the 0.786 retracement level, which may symbolize support. While macroeconomic factors could still pose risks, Stryker's commitment to innovation and expansion enhances its long-term investment appeal.
Smart Data Insight
Master the Perfect Entry & Exit for this Stock
Don't leave your profits to chance. Historically, this stock follows specific seasonal patterns that institutional traders use to maximize returns.
- ✅ Identify the "Golden Buying Window"
- ✅ Avoid high-risk correction cycles
- ✅ Backtested data from the last 20+ years