August 10, 2025 a 05:15 am

SYK: Fibonacci Analysis - Stryker Corporation
Stryker Corporation, a leading player in the medical technology sector, has shown impressive stock movements recently. Due to recent fluctuations, it's crucial to determine whether the current price levels offer a buying opportunity or indicate potential risks ahead. With its diverse segments in MedSurg, Neurotechnology, and Orthopaedics and Spine, Stryker remains well-positioned within its industry. The following technical analysis offers insights into potential price reversals or continuations based on recent trends.
Fibonacci Analysis
| Detail | Information |
|---|---|
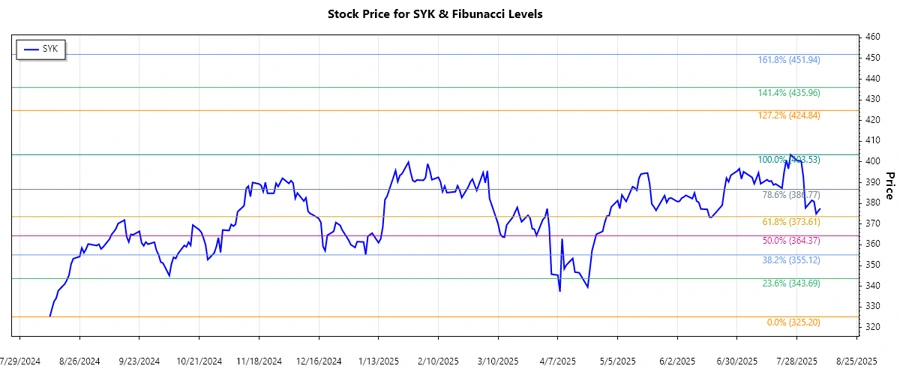
| Trend Start Date | 2024-08-12 |
| Trend End Date | 2025-07-25 |
| Highest Price (Date) | $403.53 (2025-07-25) |
| Lowest Price (Date) | $325.20 (2024-08-12) |
| Current Price | $377.58 (2025-08-08) |
| 0.236 Fibonacci Level | $343.80 |
| 0.382 Fibonacci Level | $359.01 |
| 0.5 Fibonacci Level | $364.37 |
| 0.618 Fibonacci Level | $369.73 |
| 0.786 Fibonacci Level | $377.68 |
| Analysis | The current price is slightly above the 0.786 retracement, indicating potential resistance nearby. |
| Technical Interpretation | Given proximity to the 0.786 level, a reversal or consolidation could develop, marking this area a key resistance point. |
Conclusion
The Stryker Corporation is currently experiencing a notable uptrend, having risen significantly from past lows. The market may be testing a critical resistance area around the 0.786 Fibonacci level, suggesting caution as prices could consolidate or reverse in this zone. However, surpassing this resistance could signal a continuation of bullish momentum, providing further upside potential. Investors should remain vigilant for technical confirmations in upcoming sessions as this could indicate either solidifying support or an impending pullback. With strong fundamental backing in the MedSurg, Neurotechnology, and Orthopaedics sectors, Stryker appears poised to maintain its competitive edge. Updates in market dynamics should be assessed regularly to better gauge the trajectory of SYK's stock.
Smart Data Insight
Master the Perfect Entry & Exit for this Stock
Don't leave your profits to chance. Historically, this stock follows specific seasonal patterns that institutional traders use to maximize returns.
- ✅ Identify the "Golden Buying Window"
- ✅ Avoid high-risk correction cycles
- ✅ Backtested data from the last 20+ years