
June 15, 2026 a 03:31 am
SYK: Dividend Analysis - Stryker Corporation
📊 Stryker Corporation (SYK) presents an intriguing proposition for dividend-focused investors. This analysis highlights the corporation's consistent dividend history, marked by a 36-year streak of payouts. With a current dividend yield of 1.11%, Stryker demonstrates a commitment to rewarding its shareholders amidst steady market cap growth. However, to fully understand the potential and risk, one must also consider the company's financial dynamics and market positioning.
Overview
| Metric | Value |
|---|---|
| Sector | Health Care Equipment |
| Dividend Yield | 1.11% |
| Current Dividend Per Share | 3.36 USD |
| Dividend History | 36 years |
| Last Cut or Suspension | None |
Dividend History
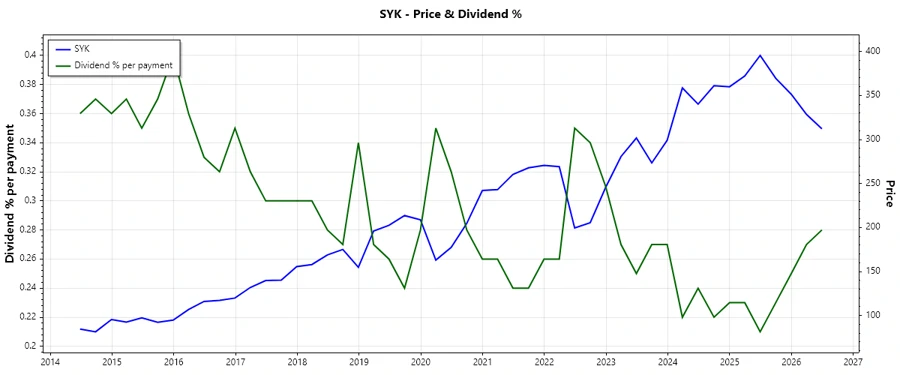
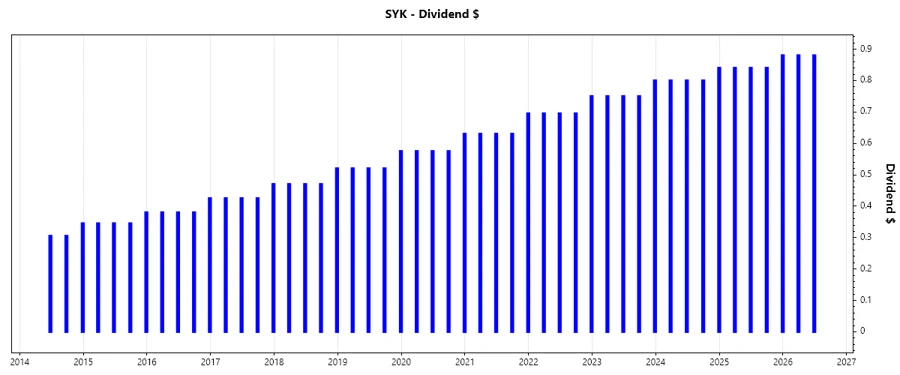
🗣️ Stryker's dividend history underscores its stability, enhancing investor confidence through reliability and consistent growth over decades.
| Year | Dividend Per Share |
|---|---|
| 2026 | 1.76 USD |
| 2025 | 3.40 USD |
| 2024 | 3.24 USD |
| 2023 | 3.05 USD |
| 2022 | 2.835 USD |
Dividend Growth
📈 Over the past 5 years, Stryker has shown moderate but consistent dividend growth of 7.62%, reflecting a healthy financial performance trajectory that aligns with shareholder interests.
| Time | Growth |
|---|---|
| 3 years | 6.25% |
| 5 years | 7.62% |
The average dividend growth is 7.62% over 5 years, showcasing a sustainable increase pattern that investors can rely on for future income streams.
Payout Ratio
📉 The payout ratios offer insight into Stryker's dividend sustainability. An EPS-based payout ratio of 38.55% and FCF-based ratio of 28.18% suggest conservative yet robust dividend policies aligning with profit retention and future growth potential.
| Key Figure Ratio | |
|---|---|
| EPS-based | 38.55% |
| Free Cash Flow-based | 28.18% |
🔎 Stryker's payout ratios indicate prudent financial management, effectively balancing between rewarding shareholders and strategic reinvestment for growth.
Cashflow & Capital Efficiency
✅Cashflow and capital efficiency indicators are key metrics reflecting a company's ability to sustain operations and invest in growth while fulfilling dividend commitments. Stryker's cash flow metrics highlight a positive financial standing, emphasizing its operational adequacy and capital reinvestment capabilities.
| Year | Free Cash Flow Yield | Earnings Yield | CAPEX to Operating Cash Flow | Stock-based Compensation to Revenue | Free Cash Flow / Operating Cash Flow Ratio |
|---|---|---|---|---|---|
| 2025 | 3.19% | 2.42% | 15.08% | 0.97% | 84.91% |
| 2024 | 2.54% | 2.18% | 17.80% | 1.01% | 82.20% |
| 2023 | 2.76% | 2.78% | 15.49% | 1.00% | 84.51% |
⚠️ These figures indicate Stryker's robust cash flow management and capital efficiency, crucial for continuous investment in business innovation and development.
Balance Sheet & Leverage Analysis
🗣️ Analyzing the balance sheet and leverage offers insights into a company's financial vulnerabilities and stability. Stryker's balance sheet metrics suggest a well-managed leverage position that supports growth initiatives and mitigates financial risks effectively.
| Year | Debt-to-Equity | Debt-to-Assets | Debt-to-Capital | Net Debt to EBITDA | Current Ratio | Quick Ratio | Financial Leverage |
|---|---|---|---|---|---|---|---|
| 2025 | 0.66 | 0.31 | 0.40 | 1.72 | 1.89 | 1.21 | 2.13 |
| 2024 | 0.68 | 0.33 | 0.41 | 2.12 | 1.95 | 1.32 | 2.08 |
| 2023 | 0.73 | 0.34 | 0.42 | 2.08 | 1.58 | 0.97 | 2.15 |
🔍 The leverage metrics demonstrate Stryker's effective debt management strategy, essential to ensure long-term financial security and flexibility.
Fundamental Strength & Profitability
⚖️ Stryker’s fundamental strength and profitability metrics are crucial in highlighting its operational efficiency and market competitiveness. These indices reflect the company's capacity to sustain profitability while maintaining strategic reinvestments.
| Year | Return on Equity | Return on Assets | Net Margin | EBIT Margin | EBITDA Margin | Gross Margin | R&D to Revenue |
|---|---|---|---|---|---|---|---|
| 2025 | 14.48% | 6.78% | 12.92% | 20.39% | 25.14% | 63.96% | 6.30% |
| 2024 | 14.51% | 6.97% | 13.25% | 17.21% | 21.85% | 61.87% | 6.26% |
| 2023 | 17.02% | 7.93% | 15.44% | 19.66% | 24.67% | 60.95% | 6.31% |
🏆 These figures underscore Stryker's strong market position, driven by high margins and effective research expenditures supporting sustainable growth.
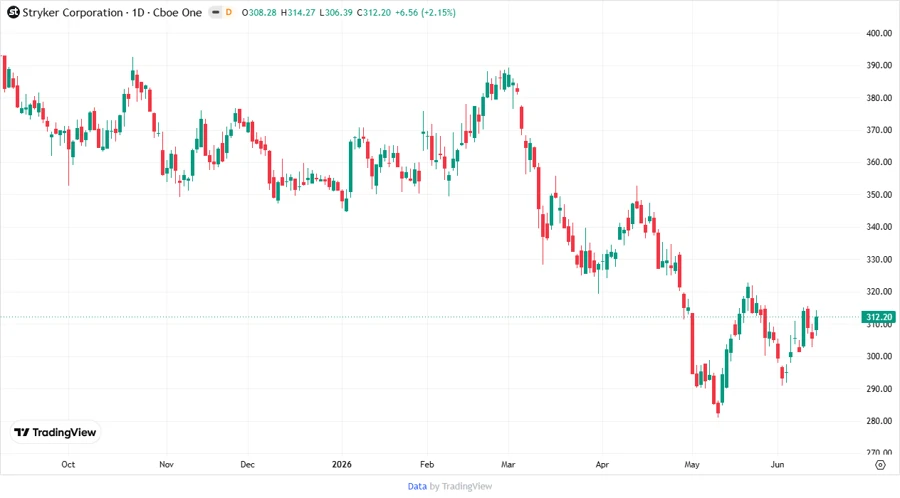
Price Development
Dividend Scoring System
| Category | Description | Score |
|---|---|---|
| Dividend Yield | Represents the ratio of dividends paid to stock price. | |
| Dividend Stability | Indicates the reliability of dividend payments. | |
| Dividend Growth | Measures the historical increase in dividend payments. | |
| Payout Ratio | Shows the portion of earnings paid to shareholders. | |
| Financial Stability | Assesses the company's ability to maintain operations and finance. | |
| Dividend Continuity | Evaluates the track record of uninterrupted dividend payments. | |
| Cashflow Coverage | Examines the coverage of dividends by cash flows. | |
| Balance Sheet Quality | Measures the health of the balance sheet. |
Total Score: 37/40
Rating
⭐ Based on the comprehensive evaluation, Stryker Corporation deserves a robust investment rating. Its solid growth history, stable financial metrics, and attractive dividend profile make it an excellent candidate for dividend-focused portfolios, with low risk and high potential for sustained income generation.
Smart Data Insight
Master the Perfect Entry & Exit for this Stock
Don't leave your profits to chance. Historically, this stock follows specific seasonal patterns that institutional traders use to maximize returns.
- ✅ Identify the "Golden Buying Window"
- ✅ Avoid high-risk correction cycles
- ✅ Backtested data from the last 20+ years