December 16, 2025 a 12:47 pm

SYK: Dividend Analysis - Stryker Corporation
Stryker Corporation has demonstrated a robust history of dividends, highlighted by a long-standing record of consistent payouts for 35 years. The company's growth trajectory and strategic financial management signal a balance between rewarding shareholders and reinvesting for future growth. With a moderate dividend yield and a strong track record, Stryker remains an attractive option for dividend-focused investors.
📊 Overview
Stryker Corporation operates in an innovative sector, constantly focusing on medical technologies that drive growth and stability.
| Metric | Value |
|---|---|
| Sector | Healthcare |
| Dividend yield | 0.96 % |
| Current dividend per share | 3.20 USD |
| Dividend history | 35 years |
| Last cut or suspension | 2009 |
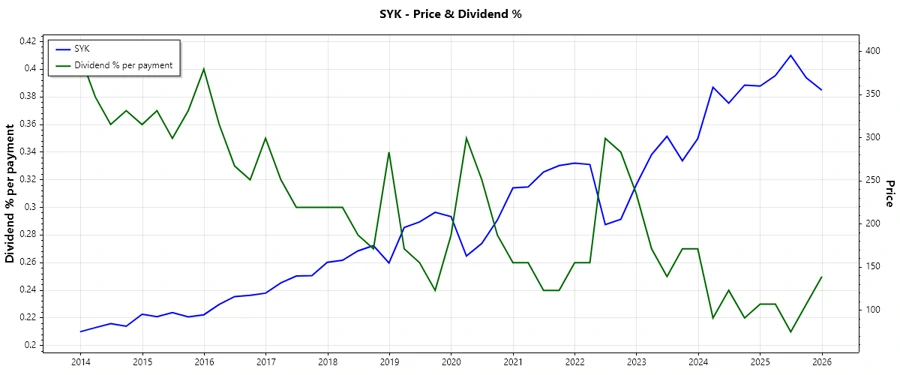
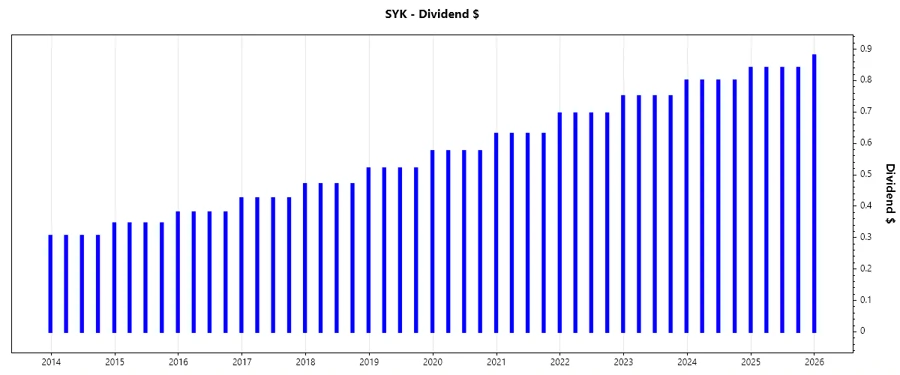
📈 Dividend History
Consistent dividend history is a testament to Stryker's financial health and cash generation capability. Since recovering from the 2009 cut, Stryker has maintained reliable and increasing dividends, appealing to long-term income investors.
| Year | Dividend per Share (USD) |
|---|---|
| 2025 | 3.40 |
| 2024 | 3.24 |
| 2023 | 3.05 |
| 2022 | 2.835 |
| 2021 | 2.585 |
📉 Dividend Growth
The ability to grow dividends consistently reflects management's confidence in long-term earnings growth and cash generation potential. Growth in dividends indicates sound financial discipline and aligns with investor interests for increased returns.
| Time | Growth |
|---|---|
| 3 years | 7.82 % |
| 5 years | 8.70 % |
The average dividend growth is 8.70 % over 5 years. This shows moderate but steady dividend growth.
✅ Payout Ratio
A balanced payout ratio ensures that Stryker can sustain dividend payments while funding operational and strategic investments, mitigating risks associated with over-leveraging dividends.
| Key Figure | Ratio |
|---|---|
| EPS-based | 41.57 % |
| Free Cash Flow-based | 30.04 % |
The payout ratio of 41.57 % (EPS) and 30.04 % (FCF) reflects a healthy balance, suggesting Stryker successfully covers dividends from earnings and maintains sufficient cash flow for growth initiatives.
🗣️ Cashflow & Capital Efficiency
Strong cash flow metrics point to Stryker's efficiency in converting revenue into cash, ensuring ample liquidity for dividends and strategic investments. Such efficiency drives superior capital utilization and return on investment.
| Year | 2024 | 2023 | 2022 |
|---|---|---|---|
| Free Cash Flow Yield | 2.54 % | 2.76 % | 2.20 % |
| Earnings Yield | 2.18 % | 2.78 % | 2.55 % |
| CAPEX to Operating Cash Flow | 17.80 % | 15.49 % | 22.41 % |
| Stock-based Compensation to Revenue | 1.01 % | 1.00 % | 0.91 % |
| Free Cash Flow / Operating Cash Flow Ratio | 82.20 % | 84.51 % | 77.59 % |
Stryker exhibits consistency in its cash flow metrics, underpinning its ability to meet operational demands and invest in growth, showcasing financial resilience and capital discipline.
⚠️ Balance Sheet & Leverage Analysis
Stryker's balance sheet strength is manifested through prudent debt management and solid leverage ratios. These factors highlight the company's financial flexibility and ability to withstand economic turbulence without overextending leverage.
| Year | 2024 | 2023 | 2022 |
|---|---|---|---|
| Debt-to-Equity | 0.68 | 0.73 | 0.81 |
| Debt-to-Assets | 0.33 | 0.34 | 0.37 |
| Debt-to-Capital | 0.41 | 0.42 | 0.45 |
| Net Debt to EBITDA | 2.12 | 2.08 | 2.91 |
| Current Ratio | 1.95 | 1.58 | 1.63 |
| Quick Ratio | 1.32 | 0.97 | 1.00 |
Stryker maintains a well-structured financial framework, showcasing prudent risk management and a stable positioning to address both short-term liabilities and long-term strategic objectives effectively.
✅ Fundamental Strength & Profitability
Stryker's profitability and fundamental financial health highlight its operational effectiveness and strategic investment outcomes, making it a reliable entity for sustainable long-term returns on investment.
| Year | 2024 | 2023 | 2022 |
|---|---|---|---|
| Return on Equity | 14.51 % | 17.02 % | 14.19 % |
| Return on Assets | 6.97 % | 7.93 % | 6.39 % |
| Margins - Net | 13.25 % | 15.44 % | 12.78 % |
| Margins - EBIT | 17.21 % | 19.66 % | 16.37 % |
| Margins - EBITDA | 21.85 % | 24.67 % | 21.78 % |
| Margins - Gross | 61.87 % | 60.95 % | 59.84 % |
| R&D to Revenue | 6.26 % | 6.31 % | 6.67 % |
Stryker's consistent returns and profit margins underline its strong market position and the effective management strategies behind sustaining high levels of profitability and shareholder value.
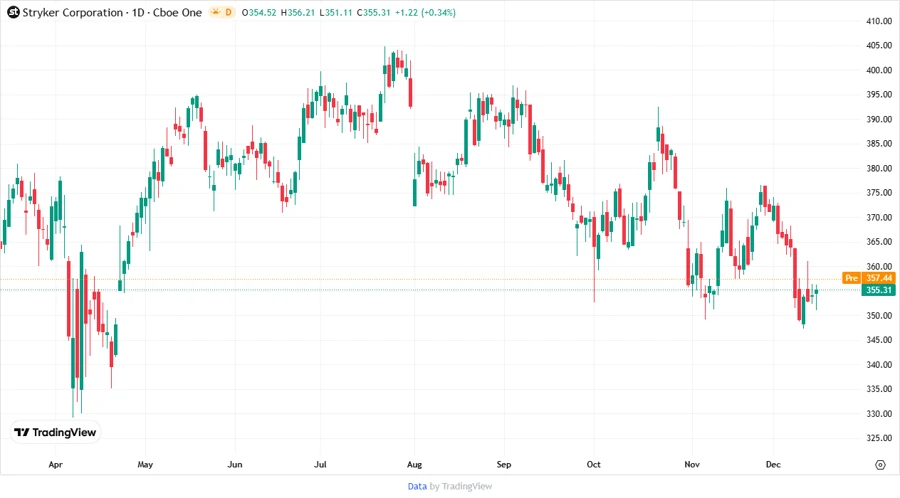
📉 Price Development
🗣️ Dividend Scoring System
| Criteria | Score | Bar |
|---|---|---|
| Dividend yield | 3 | |
| Dividend Stability | 5 | |
| Dividend growth | 4 | |
| Payout ratio | 4 | |
| Financial stability | 5 | |
| Dividend continuity | 5 | |
| Cashflow Coverage | 4 | |
| Balance Sheet Quality | 4 |
Total Score: 34/40
⚠️ Rating
In summary, Stryker Corporation exhibits strong financial stability with a well-managed dividend program. The company's strategic positioning and consistent growth in dividends make it a compelling choice for investors seeking reliable income streams. Overall, Stryker is rated highly for its dividend safety and growth potential.