July 07, 2025 a 12:46 pm


SYK: Dividend Analysis - Stryker Corporation
Stryker Corporation demonstrates a robust dividend profile with a sustained history of increasing payouts over 35 years. The firm's financial stability and efficient capital allocation are notable, making it an attractive option for dividend-focused investors. However, the current dividend yield remains modest, indicating potential for growth-driven capital appreciation.
📊 Overview
| Metric | Value |
|---|---|
| Sector | Healthcare |
| Dividend yield | 0.84% |
| Current dividend per share | $3.20 |
| Dividend history | 35 years |
| Last cut or suspension | None |
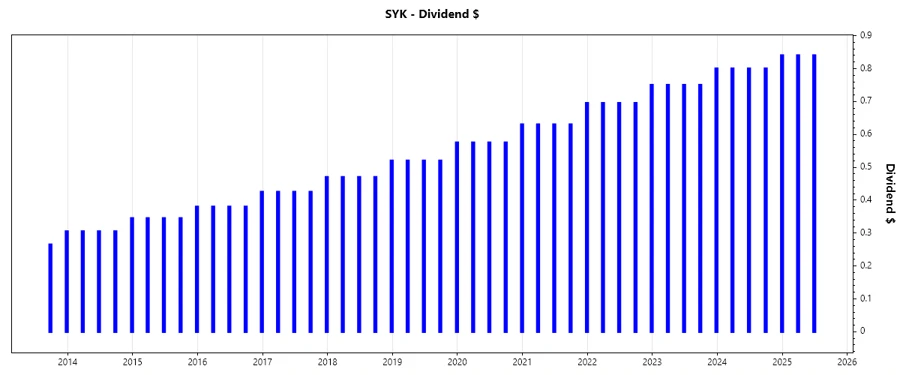
📈 Dividend History
With 35 years of consistent dividend payouts, Stryker Corporation boasts an impressive track record, highlighting its commitment to shareholder returns. This reliability makes it a cornerstone for income investors seeking stability.
| Year | Dividend Per Share (USD) |
|---|---|
| 2025 | 1.68 |
| 2024 | 3.24 |
| 2023 | 3.05 |
| 2022 | 2.835 |
| 2021 | 2.585 |
📊 Dividend Growth
The recent growth rates suggest Stryker's dividends are increasing at a healthy pace, outperforming inflation rates and supporting long-term income appreciation.
| Time | Growth |
|---|---|
| 3 years | 7.82% |
| 5 years | 8.70% |
The average dividend growth is 8.70% over 5 years. This shows moderate but steady dividend growth.
📊 Payout Ratio
Evaluating the payout ratio provides insights into the sustainability of dividend payouts. Stryker's payout ratio indicates prudent dividend management, balancing reinvestment needs with shareholder returns.
| Key Figure | Ratio |
|---|---|
| EPS-based | 42.72% |
| Free cash flow-based | 34.18% |
With an EPS-based payout ratio of 42.72% and an FCF-based ratio of 34.18%, Stryker showcases a strong ability to cover its dividends while maintaining flexibility for growth initiatives.
💡 Cashflow & Capital Efficiency
Understanding free cash flow dynamics and capital efficiency is crucial for evaluating Stryker's operational resilience and its ability to invest in growth opportunities while maintaining shareholder returns.
| Year | 2024 | 2023 | 2022 |
|---|---|---|---|
| Free Cash Flow Yield | 2.54% | 2.76% | 2.20% |
| Earnings Yield | 2.18% | 2.78% | 2.55% |
| CAPEX to Operating Cash Flow | 17.80% | 15.49% | 22.41% |
| Stock-based Compensation to Revenue | 1.01% | 1.00% | 0.91% |
| Free Cash Flow / Operating Cash Flow Ratio | 82.20% | 84.51% | 77.59% |
Stryker's stable free cash flow yields and efficient capital allocation accentuate its operational strength, providing a buffer against market volatility while enabling strategic investments.
💡 Balance Sheet & Leverage Analysis
Insight into Stryker's leverage and liquidity through comprehensive analysis of its balance sheet ratios, offering an outlook on financial flexibility and debt management capabilities.
| Year | 2024 | 2023 | 2022 |
|---|---|---|---|
| Debt-to-Equity | 0.66 | 0.70 | 0.79 |
| Debt-to-Assets | 0.32 | 0.33 | 0.35 |
| Debt-to-Capital | 0.40 | 0.41 | 0.44 |
| Net Debt to EBITDA | 1.74 | 2.03 | 2.47 |
| Current Ratio | 1.95 | 1.58 | 1.63 |
| Quick Ratio | 1.32 | 0.97 | 1.00 |
| Financial Leverage | 2.08 | 2.15 | 2.22 |
Stryker's prudent leverage strategy and robust liquidity are conducive to financial stability and resilience, fostering continued shareholder value in fluctuating economic conditions.
🌟 Fundamental Strength & Profitability
Assessing Stryker's fundamental health via profitability metrics for a deeper understanding of its competitive positioning and operational efficiency.
| Year | 2024 | 2023 | 2022 |
|---|---|---|---|
| Return on Equity | 14.51% | 17.02% | 14.19% |
| Return on Assets | 6.97% | 7.93% | 6.39% |
| Return on Invested Capital | 8.60% | 9.79% | 7.83% |
| Net Margin | 13.25% | 15.44% | 12.78% |
| EBIT Margin | 20.65% | 19.06% | 16.49% |
| EBITDA Margin | 25.30% | 24.07% | 24.59% |
| Gross Margin | 63.91% | 63.89% | 62.76% |
| Research & Development to Revenue | 6.49% | 6.77% | 7.88% |
Stryker's robust profitability metrics underscore its operational efficiency and reinforce its capacity to sustain competitive advantage through innovation and strategic investment.
🔍 Price Development
📊 Dividend Scoring System
| Criteria | Score (1-5) | Score Bar |
|---|---|---|
| Dividend Yield | 3 | |
| Dividend Stability | 5 | |
| Dividend Growth | 4 | |
| Payout Ratio | 4 | |
| Financial Stability | 4 | |
| Dividend Continuity | 5 | |
| Cashflow Coverage | 4 | |
| Balance Sheet Quality | 4 |
Total Score: 33/40
🗣️ Rating
Stryker Corporation receives a favorable rating as a dividend-paying stock, with considerable stability and consistent growth in payouts. Its financial position and capital management policies are robust, supporting sustained dividend distributions. While the yield may not be as high, the security of its dividends combined with its growth potential makes Stryker an appealing choice for conservative and growth-oriented investors alike. Continued monitoring of its payout ratios and cash flow metrics will be essential to ensure ongoing dividend reliability.
Smart Data Insight
Master the Perfect Entry & Exit for this Stock
Don't leave your profits to chance. Historically, this stock follows specific seasonal patterns that institutional traders use to maximize returns.
- ✅ Identify the "Golden Buying Window"
- ✅ Avoid high-risk correction cycles
- ✅ Backtested data from the last 20+ years