
May 26, 2026 a 03:15 am**Strukturierte Aktienanalyse für Synchrony Financial (SYF)**
SYF: Trend and Support & Resistance Analysis - Synchrony Financial
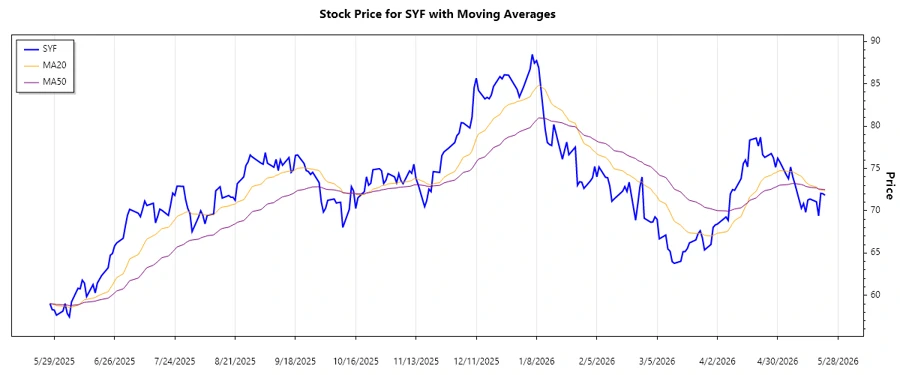
Synchrony Financial, operating primarily in the consumer financial services sector, has shown varied performance over the past months. The company's stock movements indicate potential opportunities for both short-term traders and long-term investors. By considering the calculated EMAs, and observing historic support and resistance zones, one can strategically plan entry and exit points. Despite market fluctuations, Synchrony Financial holds a resilient position, balancing potential risks and advantages for its stakeholders.
Trend Analysis
| Date | Close Price | Trend |
|---|---|---|
| 2026-05-22 | 71.83 | ▲ Upward |
| 2026-05-21 | 72.00 | ▲ Upward |
| 2026-05-20 | 72.05 | ▲ Upward |
| 2026-05-19 | 69.39 | ▼ Downward |
| 2026-05-18 | 71.05 | ▲ Upward |
| 2026-05-15 | 71.38 | ▲ Upward |
| 2026-05-14 | 71.26 | ▲ Upward |
The general trend as indicated by the EMA20 surpassing the EMA50 suggests a potential bullish outlook for Synchrony Financial, which investors might capitalize on in the near future.
Support- and Resistance
| Zone Type | From | To |
|---|---|---|
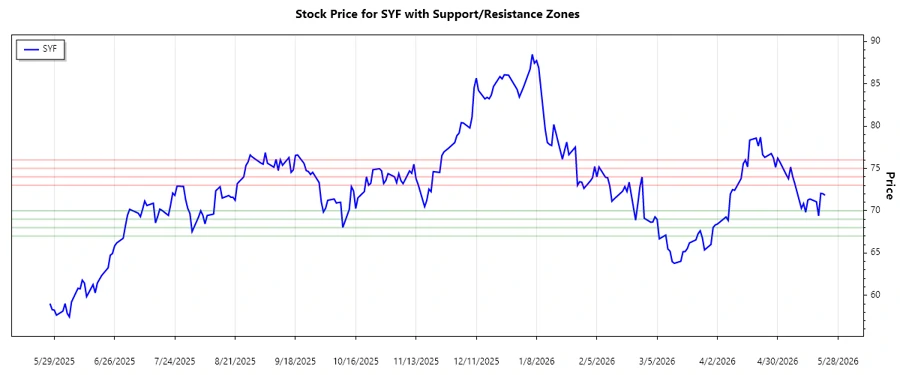
| Support Zone 1 | 69.00 | 70.00 |
| Support Zone 2 | 67.00 | 68.00 |
| Resistance Zone 1 | 73.00 | 74.00 |
| Resistance Zone 2 | 75.00 | 76.00 |
Currently, the price is lingering around the higher end of the support zones, indicating a potential opportunity for upward movement if it manages to break through the resistance zones effectively.
Conclusion
In the recent months, Synchrony Financial has demonstrated a generally upward trend, as suggested by the EMA analysis. The support and resistance zones provide a strategic framework for traders: breaching the resistance could justify a buy signal, whereas respect of the zones implies maintaining a hold strategy. Investors should weigh these technical insights along with market news and financial reports to determine optimal investment decisions. Despite intrinsic market uncertainties, Synchrony Financial remains a strong contender with robust financial underpinnings, bolstering investor confidence.
Smart Data Insight
Master the Perfect Entry & Exit for this Stock
Don't leave your profits to chance. Historically, this stock follows specific seasonal patterns that institutional traders use to maximize returns.
- ✅ Identify the "Golden Buying Window"
- ✅ Avoid high-risk correction cycles
- ✅ Backtested data from the last 20+ years