June 11, 2025 a 04:44 pm

SYF: Fibonacci Analysis - Synchrony Financial
Synchrony Financial has shown resilience in its market position as a major consumer financial services company. Its stock, SYF, has experienced notable fluctuations, reflecting broader economic trends and consumer spending behaviors. Recent months have seen a pronounced movement, which, when analyzed through technical lenses, provides key insights into potential future trajectories.
Fibonacci Analysis
| Trend Period | Start Date | End Date | High Price (Date) | Low Price (Date) |
|---|---|---|---|---|
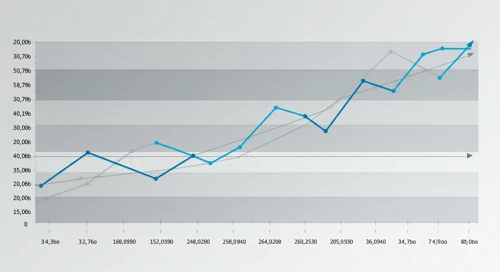
| Dominant Downtrend | 2025-01-24 | 2025-06-11 | $70.63 (2025-01-24) | $46.13 (2025-04-11) |
| Fibonacci Level | Price |
|---|---|
| 0.236 | $52.73 |
| 0.382 | $56.51 |
| 0.5 | $58.38 |
| 0.618 | $60.25 |
| 0.786 | $63.04 |
The current price of $61.91 is just above the 0.618 Fibonacci retracement level, indicating a possible resistance level in the short term.
The price hovering around these key Fibonacci levels might demonstrate potential reversal zones or continuations in Synchrony’s stock movement, depending on upcoming market conditions.
Conclusion
Synchrony Financial's stock has been navigating through a dominant downtrend, with recent lows indicating potential critical analysis points. The Fibonacci retracement helps ascertain likely support and resistance levels, guiding investors in decision-making through technical indicators. While there are opportunities for rebounds, caution is advised with prevailing economic uncertainties that could further influence investor sentiment. Analysts should remain vigilant to shifts in the broader market environment that might alter forecasts and strategic positions.
Smart Data Insight
Master the Perfect Entry & Exit for this Stock
Don't leave your profits to chance. Historically, this stock follows specific seasonal patterns that institutional traders use to maximize returns.
- ✅ Identify the "Golden Buying Window"
- ✅ Avoid high-risk correction cycles
- ✅ Backtested data from the last 20+ years