January 16, 2026 a 07:46 am

SYF: Dividend Analysis - Synchrony Financial
Synchrony Financial demonstrates a robust dividend profile with a history of consistency and growth, highlighted by attractive payouts and a stable yield. Despite economic fluctuations, the company's commitment to shareholder returns appears reliable. Its conservative payout ratio suggests sustainability and potential for future increases.
📊 Overview
| Metric | Details |
|---|---|
| Sector | Financial |
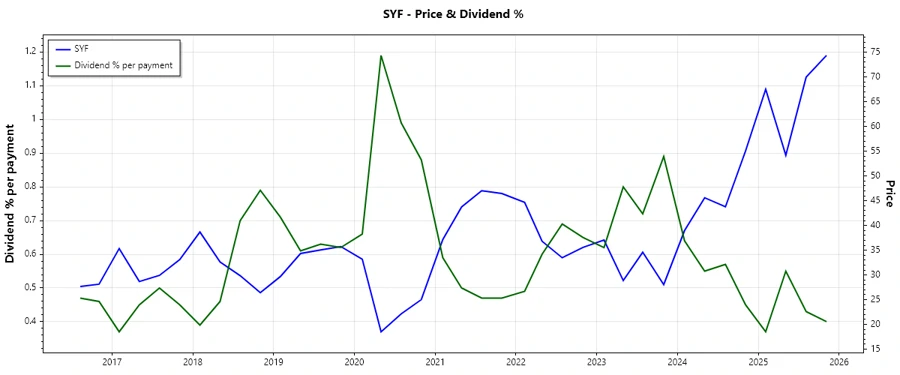
| Dividend yield | 1.55 % |
| Current dividend per share | 1.19 USD |
| Dividend history | 10 years |
| Last cut or suspension | None |
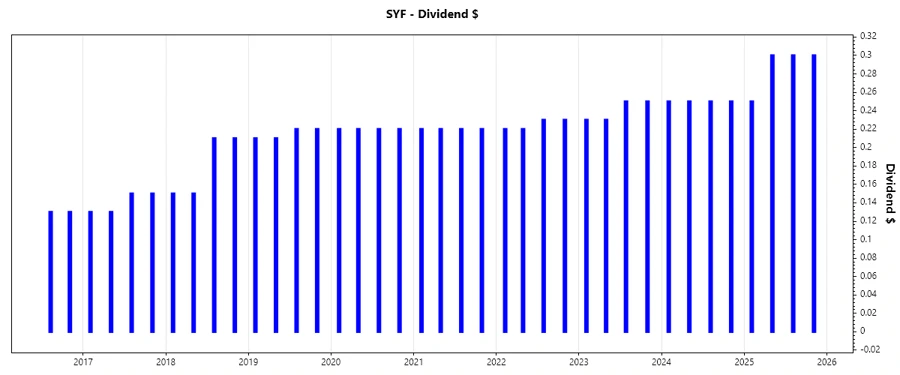
🗓️ Dividend History
The consistent history of dividends is a cornerstone of Synchrony Financial's commitment to investor returns. A steady increase over the years reflects both management's confidence in ongoing cash flow and the financial health necessary to support rising shareholder distributions.
| Year | Dividend Per Share (USD) |
|---|---|
| 2025 | 1.15 |
| 2024 | 1.00 |
| 2023 | 0.96 |
| 2022 | 0.90 |
| 2021 | 0.88 |
📈 Dividend Growth
The growth of dividends over 3 and 5 years at 8.51% and 5.50% respectively illustrates a moderate upward trajectory. This trend signifies an encouraging prospect for continued dividend expansions, allowing investors to share in the company's success.
| Time | Growth |
|---|---|
| 3 years | 8.51 % |
| 5 years | 5.50 % |
The average dividend growth is 5.50% over 5 years. This shows moderate but steady dividend growth.
🔍 Payout Ratio
Payout ratios indicate the proportion of earnings and free cash flow used for dividend payments. EPS-based payout ratio of 12.46% and FCF-based payout ratio of 4.61% suggest that dividends are well-covered by both earnings and cash flow, highlighting both sustainability and financial resilience.
| Key figure | Ratio |
|---|---|
| EPS-based | 12.46 % |
| Free cash flow-based | 4.61 % |
The EPS-based payout ratio of 12.46% and FCF-based ratio of 4.61% indicate strong coverage and financial soundness, ensuring dividend stability.
💰 Cashflow & Capital Efficiency
Analyzing key cash flow metrics reveals how Synchrony Financial manages its capital resources effectively. The interplay between free cash flow yield and earnings yield illustrates a robust cash generation capacity, while a high free cash flow to operating cash flow ratio signifies operational efficiency.
| Year | 2024 | 2023 | 2022 |
|---|---|---|---|
| Free Cash Flow Yield | 38.21 % | 53.42 % | 42.40 % |
| Earnings Yield | 13.58 % | 13.91 % | 19.11 % |
| CAPEX to Operating Cash Flow | 0 % | 0 % | 0 % |
| Stock-based Compensation to Revenue | 0 % | 0 % | 0 % |
| Free Cash Flow / Operating Cash Flow Ratio | 100 % | 100 % | 100 % |
Strong free cash flow and efficient use of capital support continued dividend payments and indicate effective allocation of financial resources.
📑 Balance Sheet & Leverage Analysis
Balance sheet metrics such as debt ratios are crucial for assessing financial stability. A debt-to-equity ratio of 0.93 suggests balanced leveraging, while indicators like the quick ratio provide insight into liquidity management.
| Year | 2024 | 2023 | 2022 |
|---|---|---|---|
| Debt-to-Equity | 0.93 | 1.15 | 1.10 |
| Debt-to-Assets | 0.13 | 0.14 | 0.14 |
| Debt-to-Capital | 0.48 | 0.53 | 0.52 |
| Net Debt to EBITDA | 0.15 | 0.51 | 0.89 |
| Current Ratio | 0.22 | 0.22 | 0.20 |
| Quick Ratio | 0.22 | 0.22 | 0.20 |
| Financial Leverage | 7.21 | 8.45 | 8.12 |
The leverage metrics highlight a careful balance between risk and growth, while maintaining liquidity supports a stable financial outlook.
📊 Fundamental Strength & Profitability
Profitability ratios such as return on equity and asset margins demonstrate the company's adept operation and financial efficiency, highlighting its capacity to yield attractive returns to investors.
| Year | 2024 | 2023 | 2022 |
|---|---|---|---|
| Return on Equity | 21.10 % | 16.10 % | 23.43 % |
| Return on Assets | 2.93 % | 1.91 % | 2.88 % |
| Margins: Net | 16.86 % | 12.91 % | 22.86 % |
| Margins: EBIT | 21.93 % | 16.75 % | 30.03 % |
| Margins: EBITDA | 24.25 % | 19.39 % | 33.20 % |
| Margins: Gross | 45.24 % | 44.19 % | 62.90 % |
| R&D to Revenue | 0 % | 0 % | 0 % |
Synchrony Financial's profitability remains strong, with robust margins and high returns on equity, which underpin its revenue-generating efficiency.
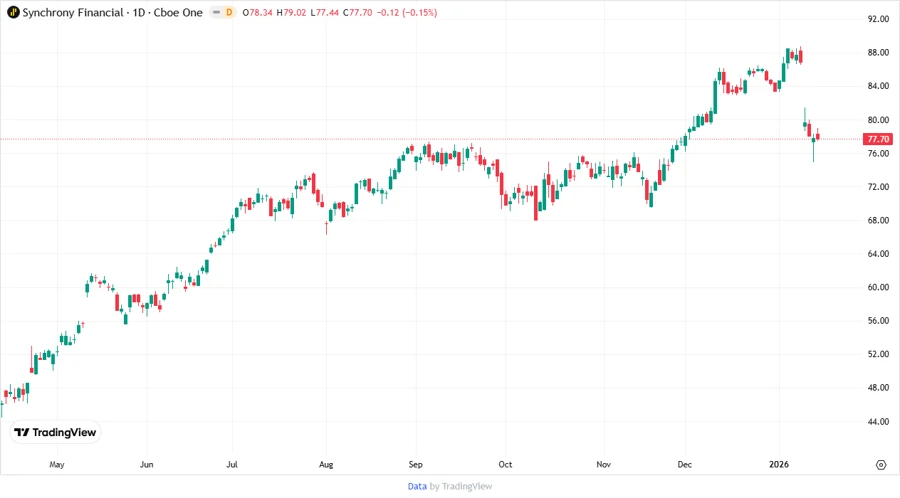
🔮 Price Development
📈 Dividend Scoring System
| Criteria | Score | Bar |
|---|---|---|
| Dividend yield | 3 | |
| Dividend Stability | 5 | |
| Dividend Growth | 4 | |
| Payout ratio | 5 | |
| Financial stability | 4 | |
| Dividend continuity | 5 | |
| Cashflow Coverage | 4 | |
| Balance Sheet Quality | 4 |
Total Score: 34/40
🔍 Rating
Synchrony Financial exhibits a commendable dividend profile with consistent growth, well-covered payout ratios, and solid financial fundamentals. The company is an attractive option for income-focused investors, yielding a strong recommendation for those seeking stable dividend growth with manageable risk profiles.